Improvements to Dashboard Gadgets
With version 5.2.0-Topgun of Onesait Platform we have improved the functioning and appearance of the predefined Gadgets that we have in the Dashboards.
The main improvement has been the inclusion of the Vue and ECharts libraries for the creation of these Gadgets, thus offering greater technical power, as well as a revised style.
The Gadgets that have been renewed in this version are the following:
- Pie
- Line
- Bar
- Table
- Map
In this version, these Gadgets can be found in the drop-down menu that appears on the right side of the screen while editing a Dashboard.
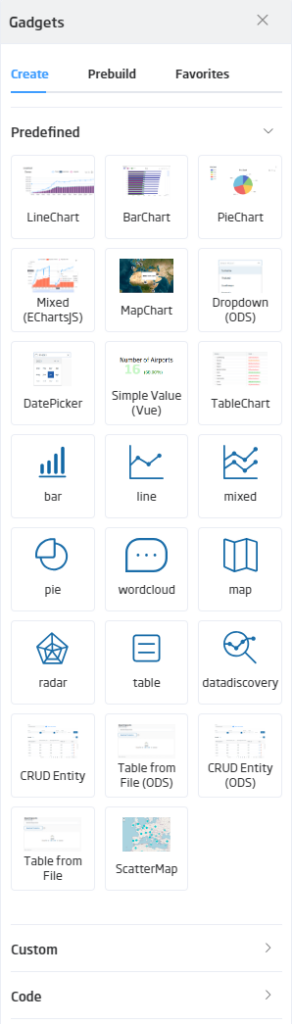
From here we will be able to drag them and configure the parameters that we want to appear in them, until we get, for example, something like this:
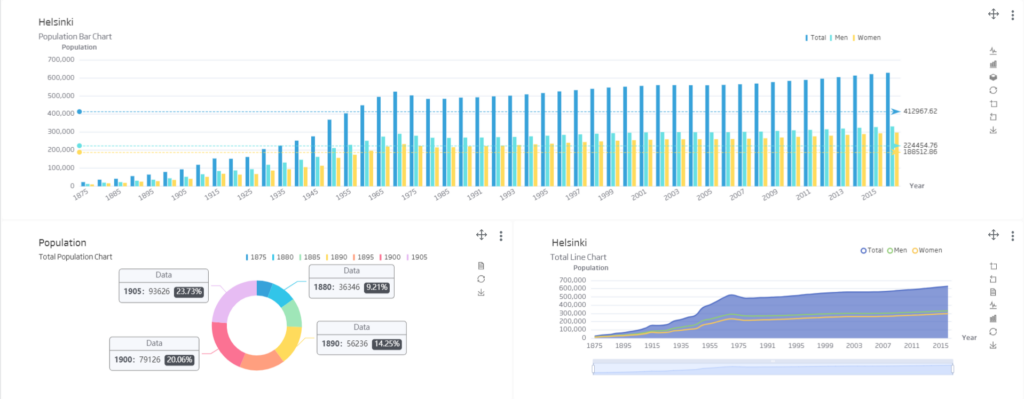
Let’s take a look at what changes are included in each of these updated Gadgets.
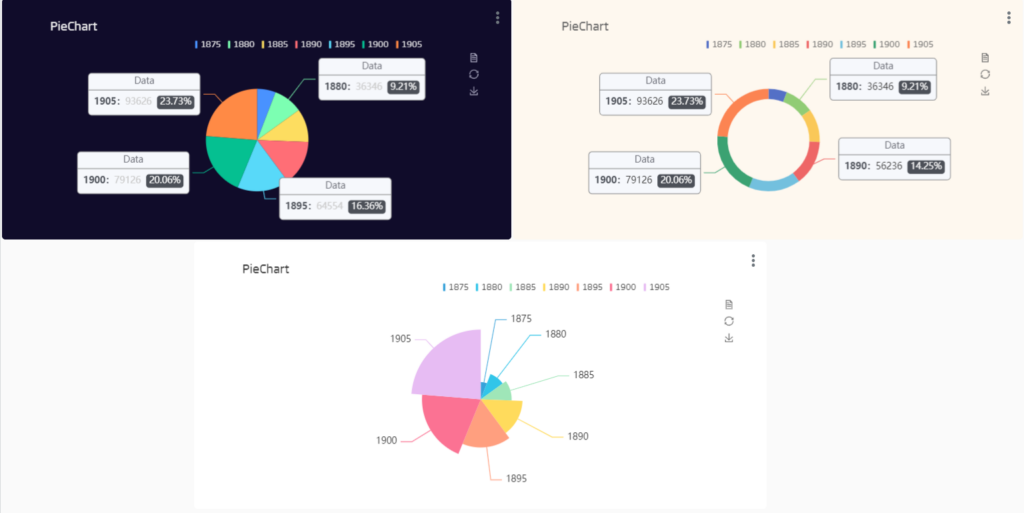
Pie
We will be able to set different layouts of the graphic from the configuration, as well as the style of the footer. In the same option there is also a button that will give us the possibility to reset the filters that affect our gadget.
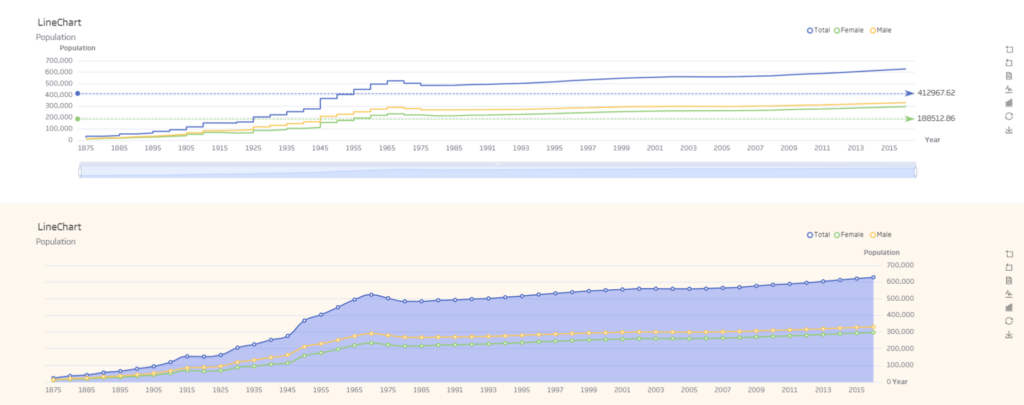
Line
This chart has major updates. Among them we find the customisation of styles on each series of data and the possibility of establishing a marker on the maximum and minimum points, as well as an average line in your data.
Focusing on the top right of the graph, we will be able to find different buttons that give access to new functionalities. With the first one from the left we will be able to zoom in on the part we are interested in, and with the second one we will reset the zoom level.
The following buttons will allow us to switch between a line or a bar chart. Finally, we will have the options to save the graph as an image and to reset the filters that affect it.
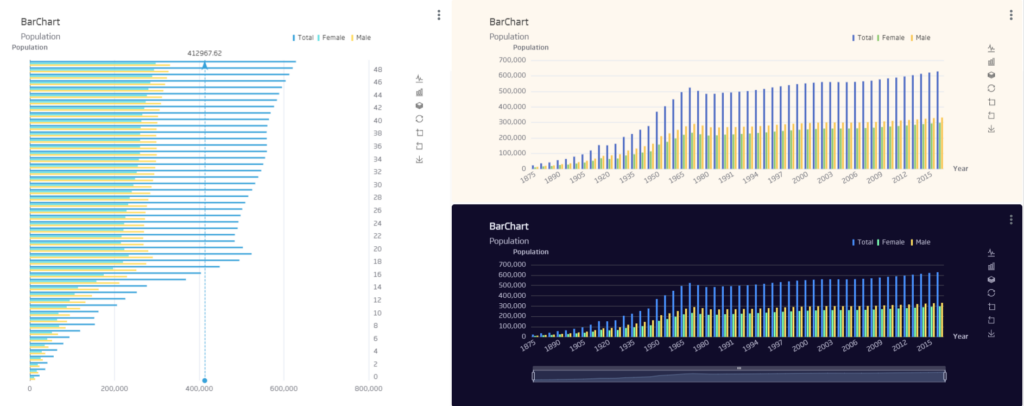
Bar
Regarding the customisation of this gadget, we can highlight the new possibility of creating it in vertical or horizontal position, as well as the new zoom bars that allow you to centre it from the beginning on a specific section of the graph.
With the buttons located in the upper right corner of the chart, we will have the possibility to change to a “Stack” style, switch between a line or bar chart, zoom to a specific part of the data, save the data as an image and reset the filters that affect this gadget.
With these improvements we offer different options to get more customised styles as we can see below:
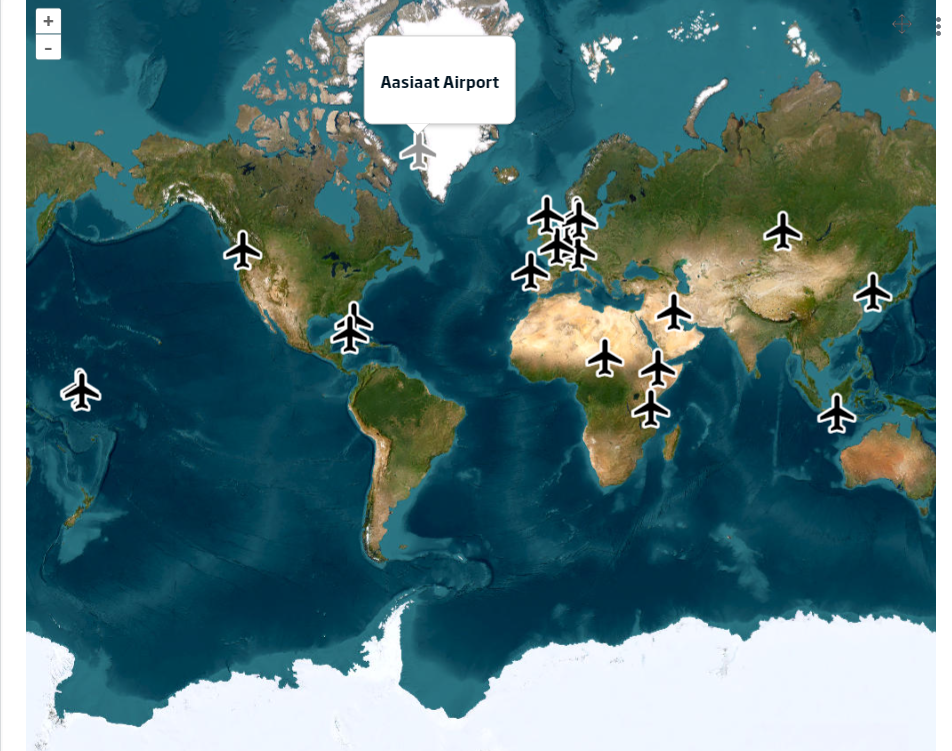
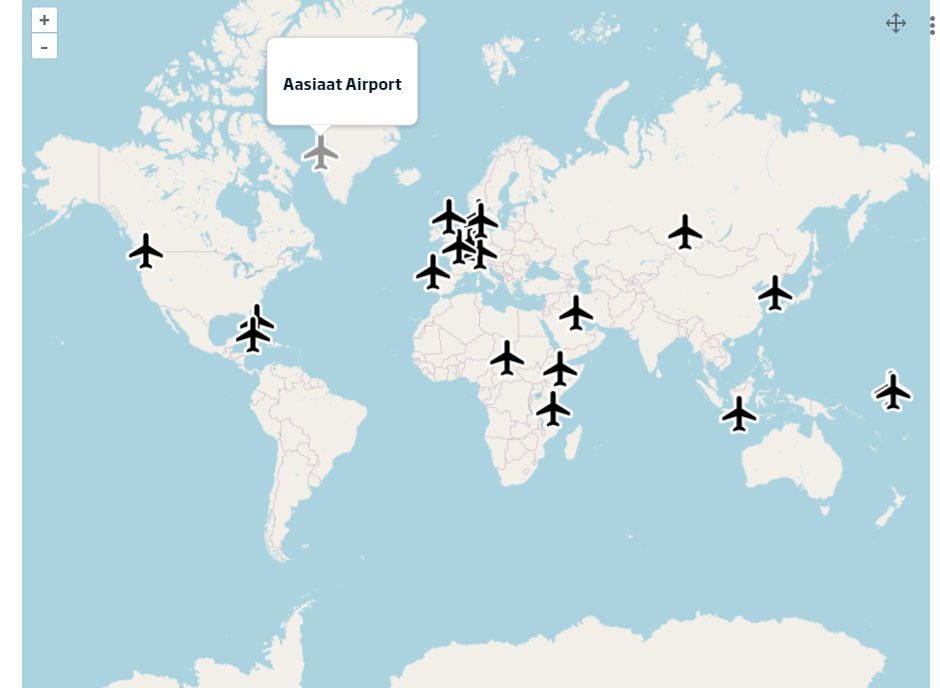
Map
The previous gadget has been completely updated to include in this new version the OpenLayers library, which allows to extend the functionalities and give a new style to this graphic.
When it comes to the configuration, we will be able to choose from a wide variety of icons as Google’s Material Icons library is used.
We will be able to select different types of base map, such as the global orthoimage or the OpenStreetMaps basemap.
We also have the possibility of creating a popup when clicking on each entity on the map that contains all the information we are interested in, as well as the option to change the style of the marker when selecting it in order to have more visual aid.
As a new addition, there is the option to create “rules” that affect the colour of the markers, so that, for example, if we have a temperature map, the marker will change colour depending on the temperature, thus being able to create choropleth maps.
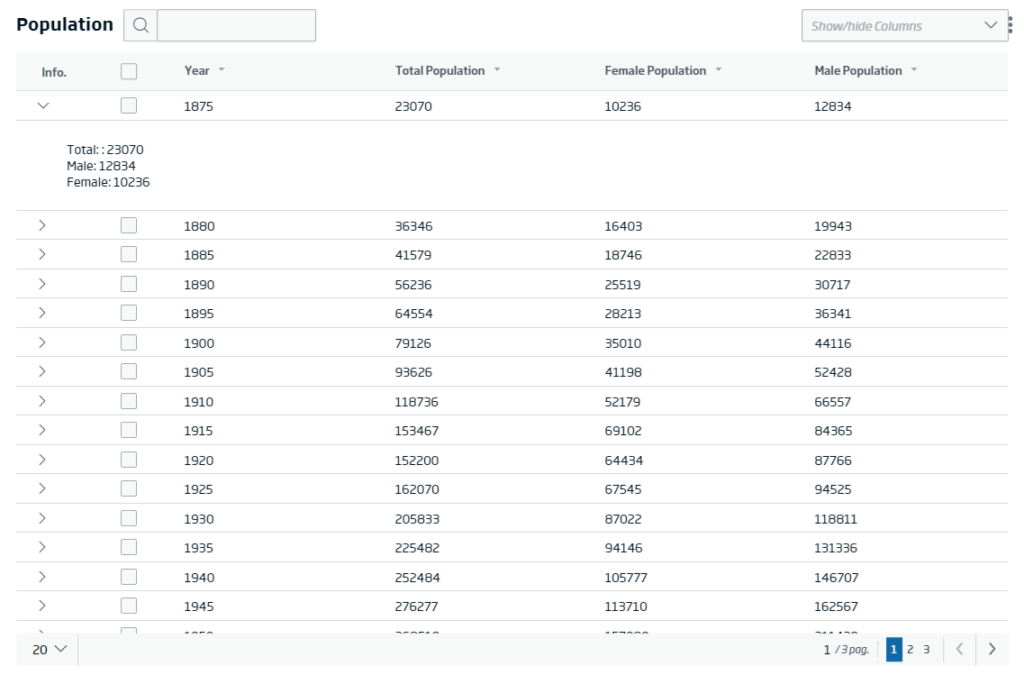
Table
As for this Gadget, we have updated the style giving it a completely new design and allowing a greater configuration of the data displayed per column.
With this update, it is possible to create rules that allow you to change the colour of the data displayed, for example so that if that data is greater than 100 the colour is changed to red.
There is also now the possibility to add common suffixes and prefixes to all data, as well as to configure the message to be displayed in case there is no data for that column.
Other improvements
In addition to updating the Gadgets, we have included a number of new enhancements.
Native export to XLSX format
Gadgets based on templates have a native export to XLSX format, with the option “Download Data” appearing in the menu of each Gadget.
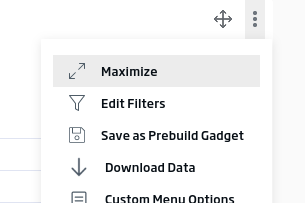
This download, if you want to adjust it in the template, can be done by overriding the “vm.downloadData” function.
Other Changes
- Improvements in Gadget filter by selector (Vue Select) and inclusion of native datapicker.
- Improvements in the Gadget template editor.
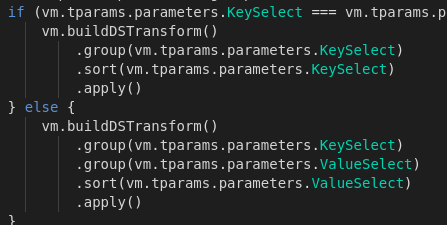
- Default transform: it is now possible to send transformations (filters or operations on the DataSource) before launching the initial DataSource.
As we can see, we have incorporated quite a few visual improvements to the Gadgets, so now our Gadgets will look better and have more functionality.
If you are interested in learning more about this new upgrades or in seeing a demo of how it works, do not hesitate to leave us a comment or send us a notice on our Onesait Platform support channel.
Header image: Liza Pooor at Unsplash.