Demonstrator: Integration with IBM Maximo
This demonstrator focuses on the integration of IBM Maximo with the Platform, for the exploitation of the data stored in Maximo from the Platform. For this demonstrator, we have used records of its assets and work orders.
To carry out this integration with Maximo, there are two possible paths:
- Use the REST APIs offered by Maximo.
- Connect to the Maximo asset database.
In the demonstrator, we have decided to connect with the Maximo database to bring the information on the Platform. For this, we use the DataFlow module to connect with the Maximo tables, extract the information and store it in the Platform’s Entities.
Once we have the data stored, we have created some REST APIs and exploitation Dashboards.
Demonstrator Components
Security
For the demonstrator, the Platform‘s security has been integrated through a Realm of the Platform itself. Certain Platform users have been assigned a Realm role, and this role is the one that gives them access to one or other Dashboard.
DataFlow
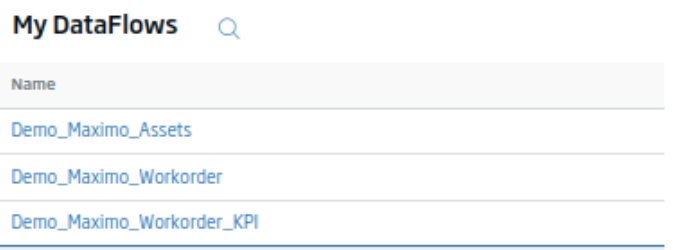
To integrate with IBM Maximo, we have created three DataFlow pipelines:
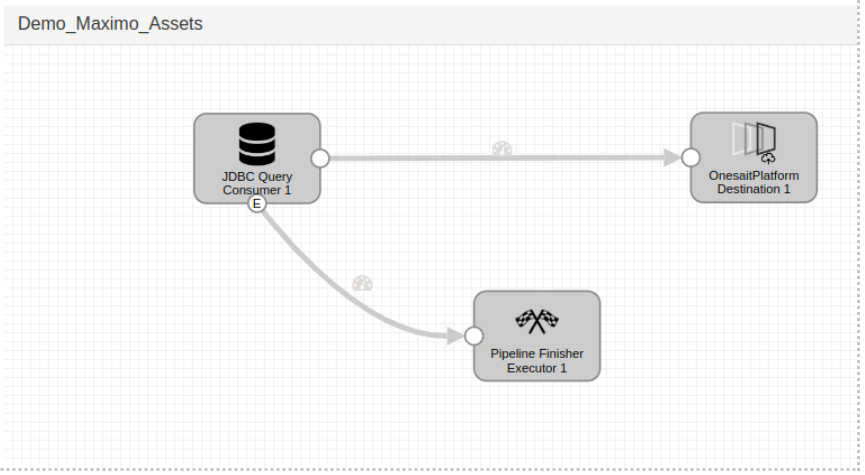
All three pipelines are similar, consisting of three components:
- The JDBC Query connection with IBM Maximo.
- The Pipeline Finisher, which detects when data is finished and stops the process.
- The OnesaitPlatform Destination, which is where we indicate how the bulk insertion will be carried out in the Platform’s entities.
Entities
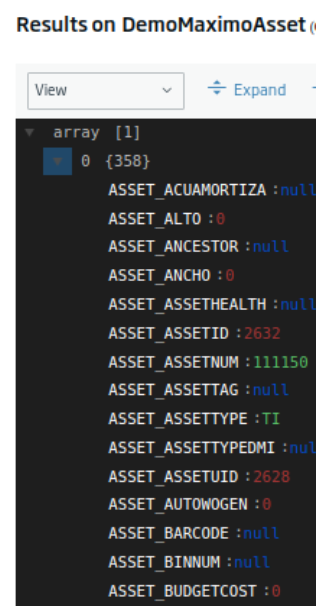
For this purpose, we have created three Entities in the Platform:
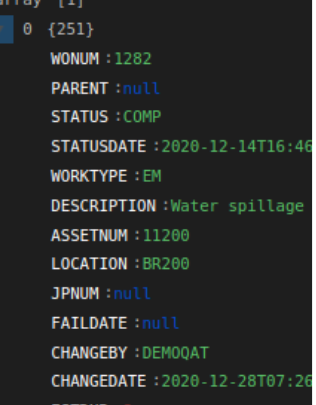
- One for the assets with all the information, in the order of 358 parameters per record:
- Another entity with the work orders:
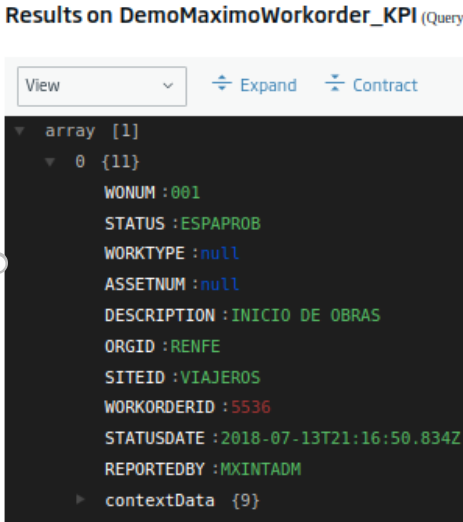
- And a third with the information of the work orders, processed to show it in different KPIs:
Dashboards
We have created two dashboards: one to display asset information, and the other to display work order information.
DemoMaximoWorkorder
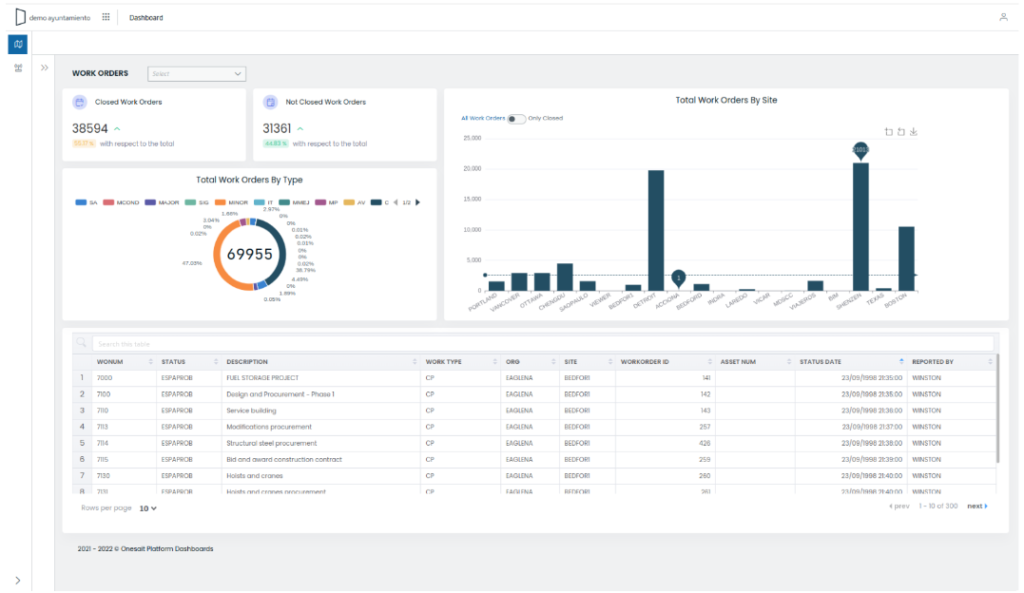
This dashboard is made up of different elements:
Organization selector
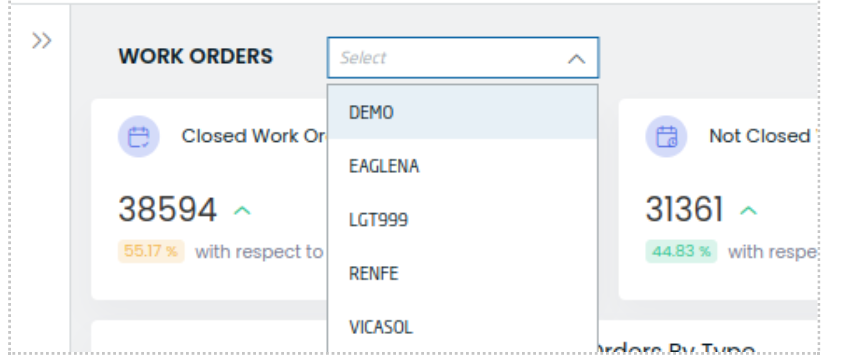
This selector allows to filter all Dashboard items by organization. It is multi-select. so more than one organization can be selected.
KPI of total closed work orders
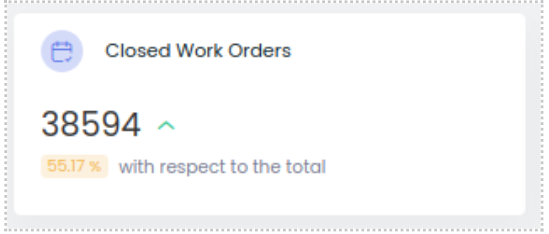
This card shows the value and percentage of total orders.
Comparison of total work orders by type
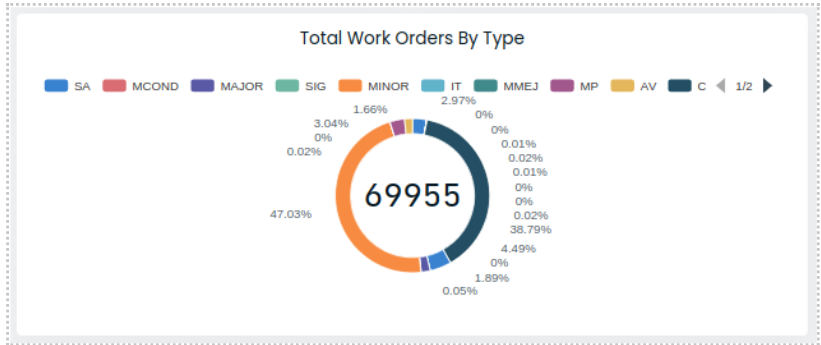
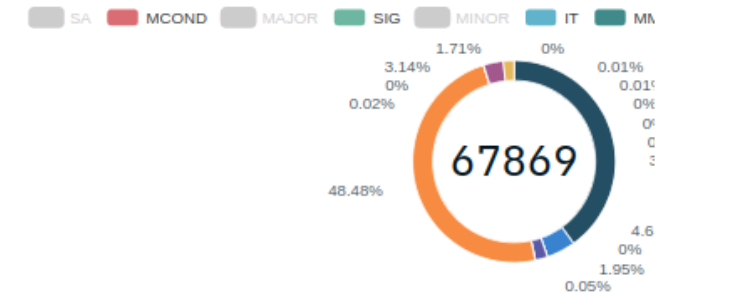
In the center, the total number of elements is shown, and around it, the percentage for each type with respect to the total. It has a paginated key and values can be hidden from the graph by clicking their color on the top legend. After unchecking them, they appear in gray:
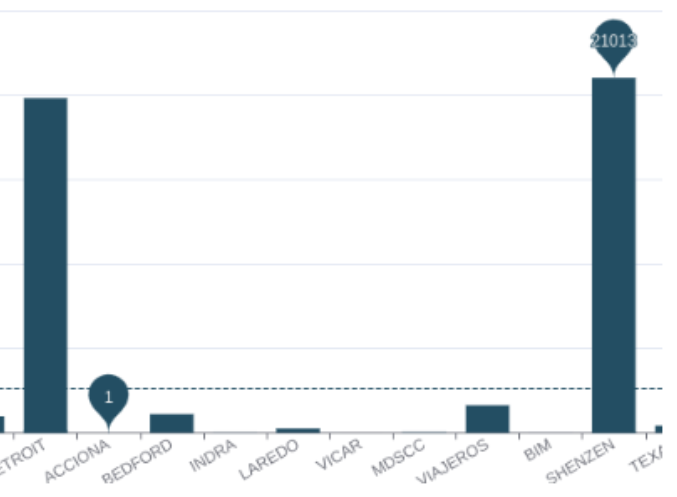
Total work orders per site
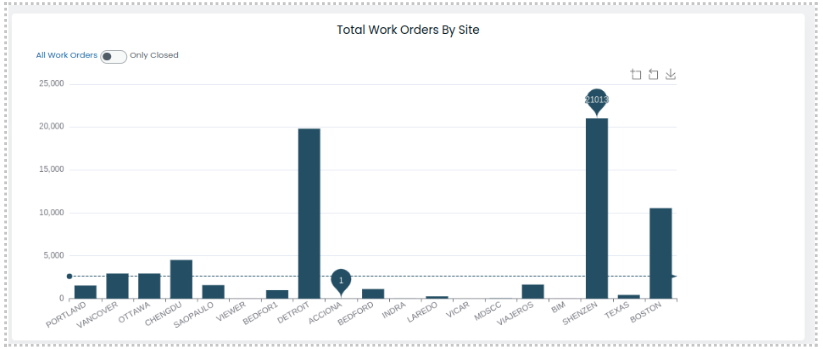
On the bar chart, the X axis shows the sites, and the Y axis is for total cumulative orders per site.
Possible actions
You can show the total values, or only the orders closed, with the switcher:

Besides, you can use the zoom by activating it with these buttons, and download the graph in image format:

In the bar graph, the maximum, minimum and average values are also indicated for the displayed values:
Non-closed work orders table
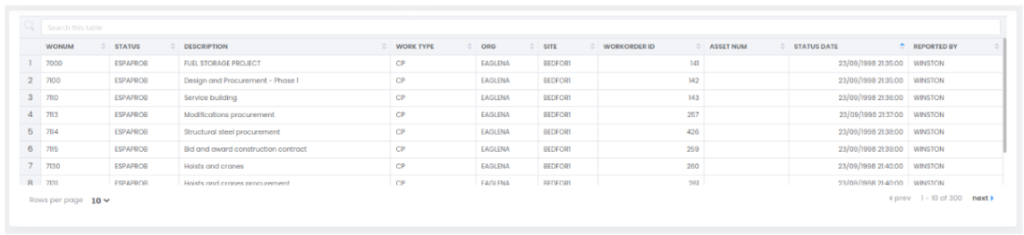
Non-closed work orders are shown. You can filter the results by typing next to the magnifying glass icon, then pressing the «Enter» key. The table also features sorting and pagination.
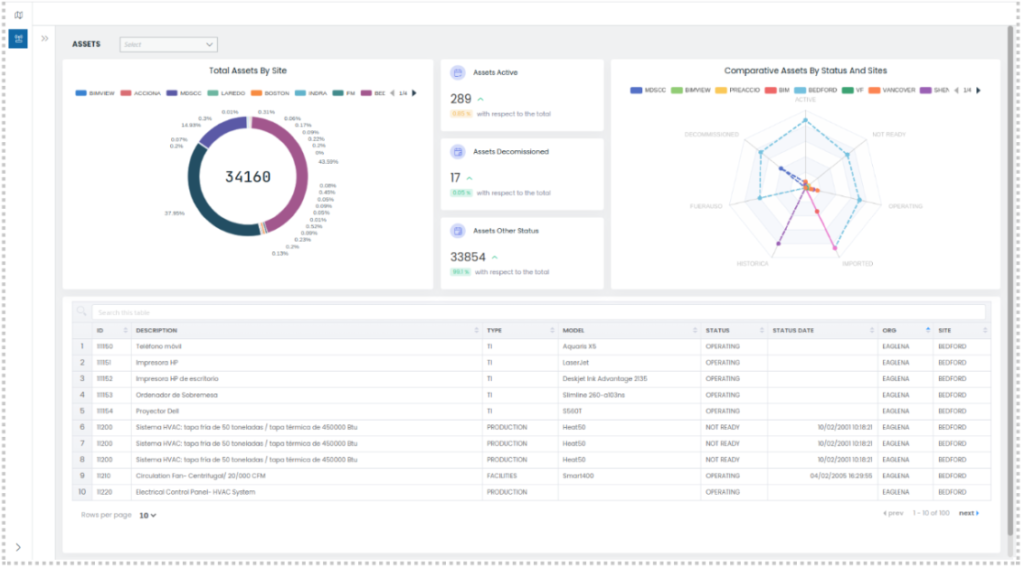
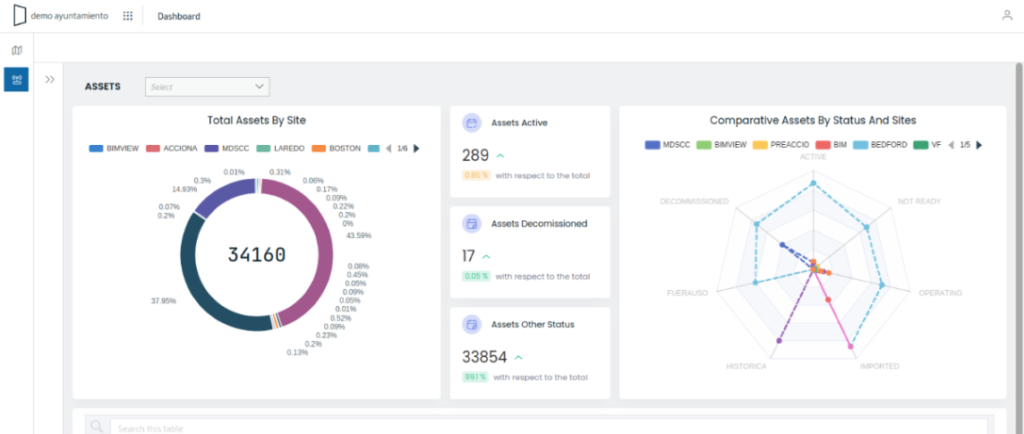
DemoMaximoAssets
Organization Selector
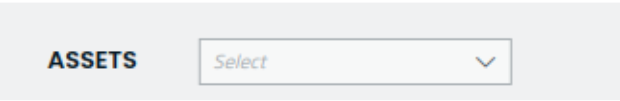
This selector allows you to filter all Dashboard items by organization. It is multi-selection so more than one organization can be selected.
Comparison of assets by state and site
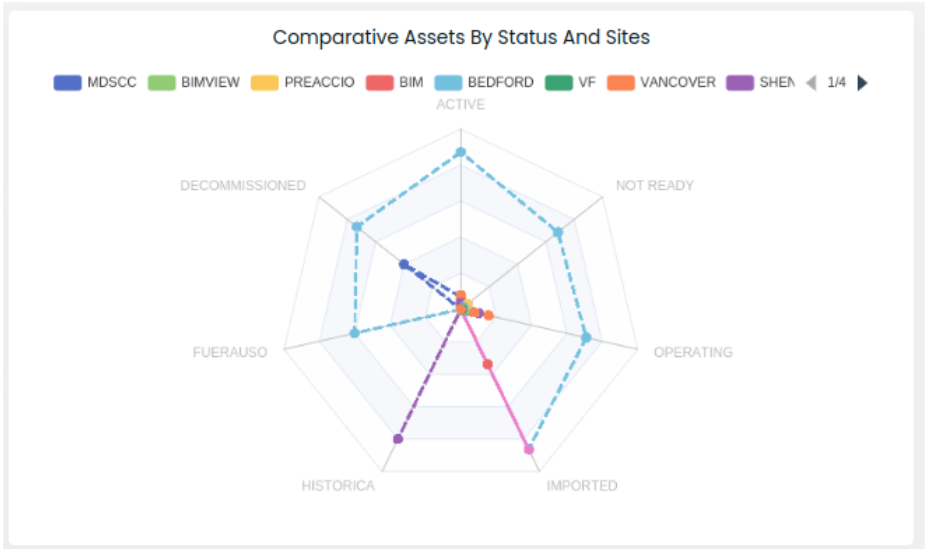
This radar-type graph shows the comparison of the number of assets that each site has, for the different states.
Asset information table
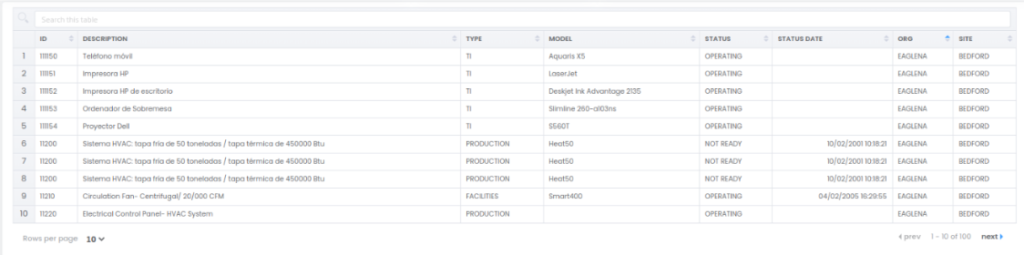
A summary of the asset’s information is displayed. You can filter the results by typing next to the magnifying glass icon and pressing the «Enter» key. The table also features sorting and pagination:
REST APIs
Two REST APIs have been created, one for assets and one for work orders:
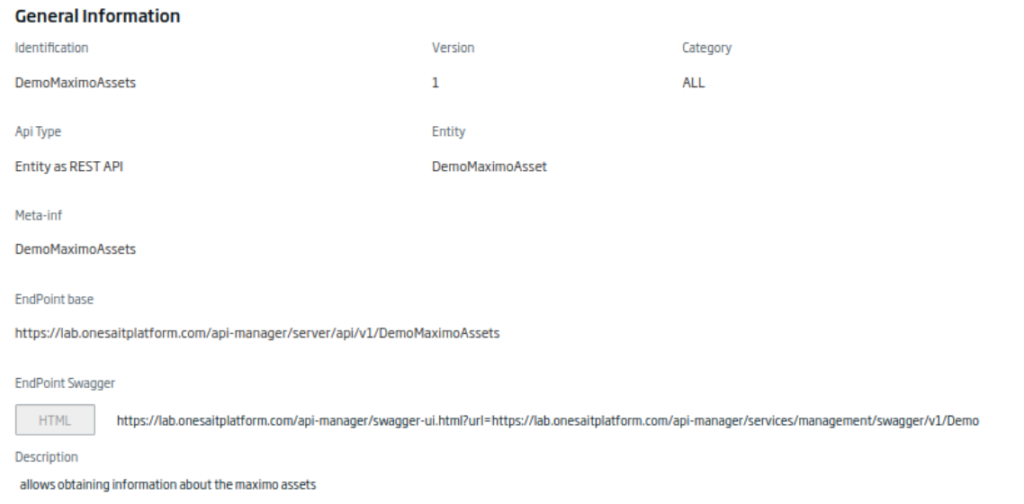
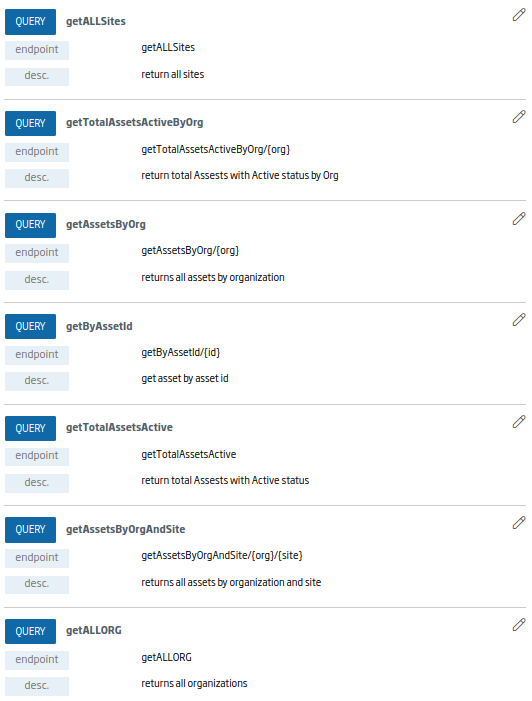
DemoMaximoAssets API
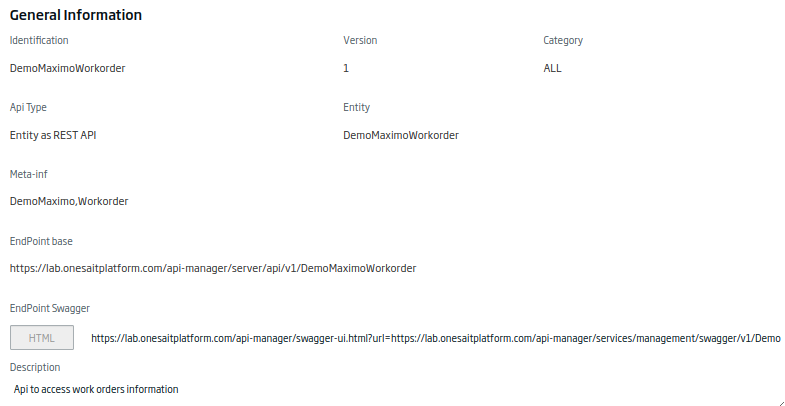
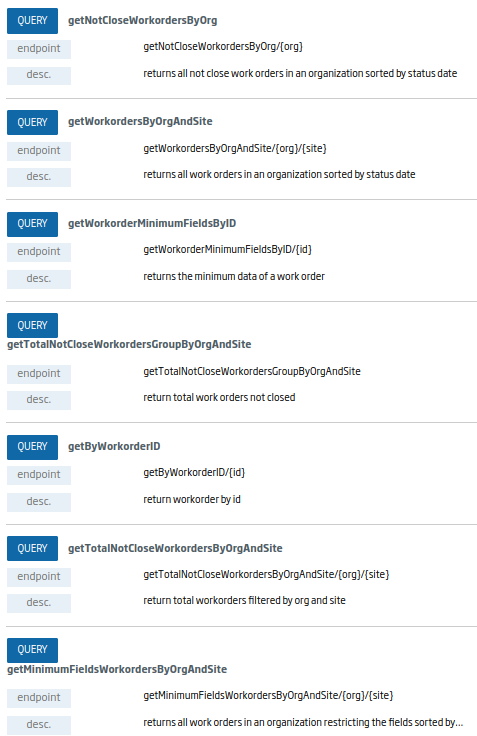
DemoMaximoWorkOrder API
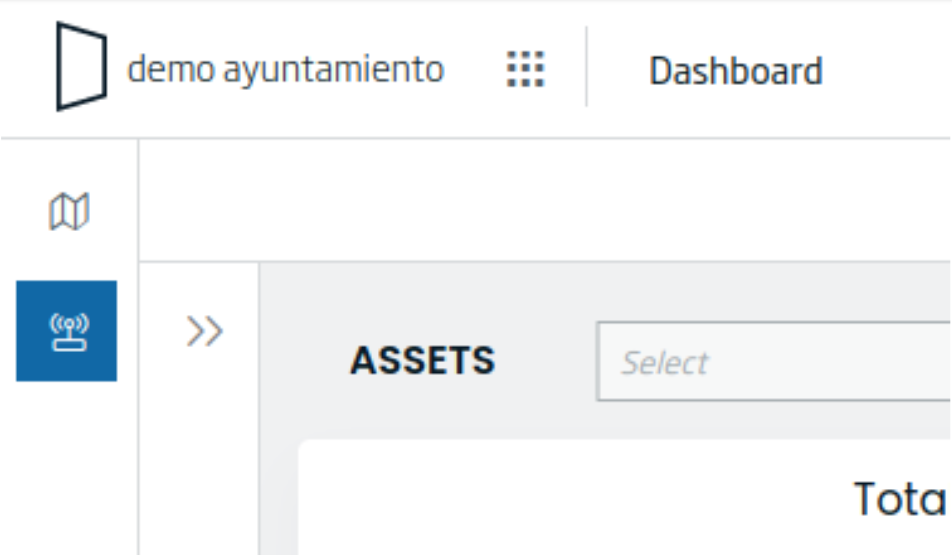
Web applications
Two applications have been deployed on the Platform:
- ods-cdnn: This web project contains common libraries and resources, necessary for the application.
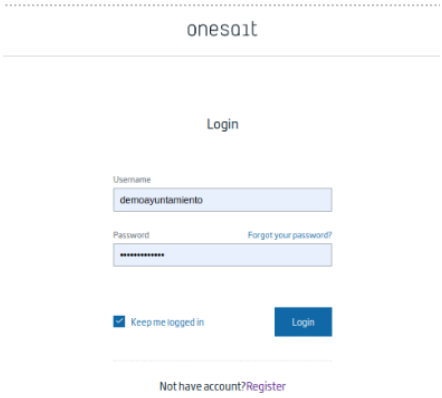
- DemoAyuntamiento: is the framework application developed with VUE JS. It allows agile developments like this, and has integrated the login with the Platform’s security.
It also has the Platform’s Dashboards wrapper integrated:
From here, you can access the centralized configuration files to manage the different menus, with sub-menus being available:
It also shows the information of the user who has accessed:
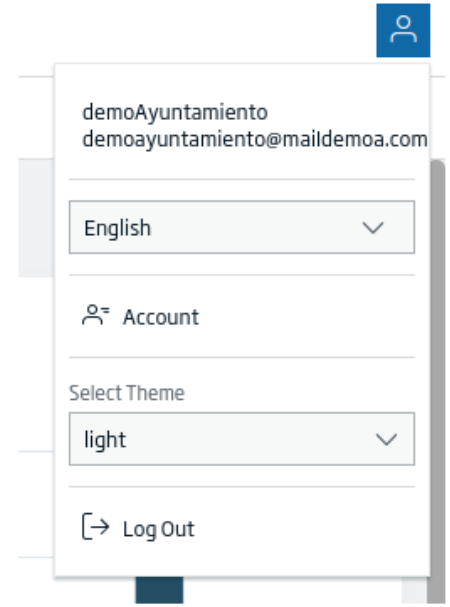
From the Platform, you can create an internationalization entry so that the application can be multilanguage.
Realm
A Realm has been created to associate it to a project and to be able to differentiate through user roles which resources those users have access to in the application.
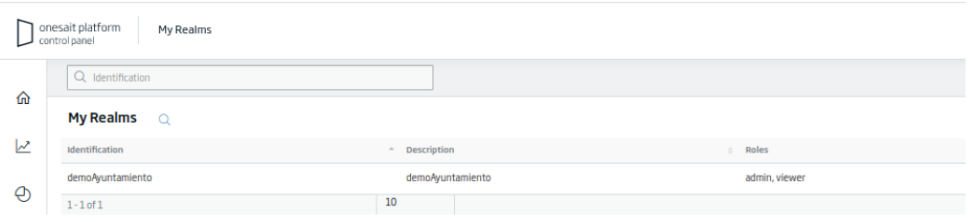
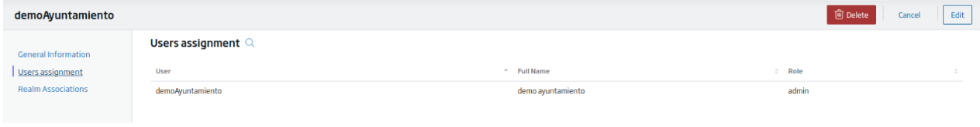
In this Realm, the user «demoayuntamiento» has been given the role of «administrador»:
Project/Application
In order to give access to the different resources, a project has been created:
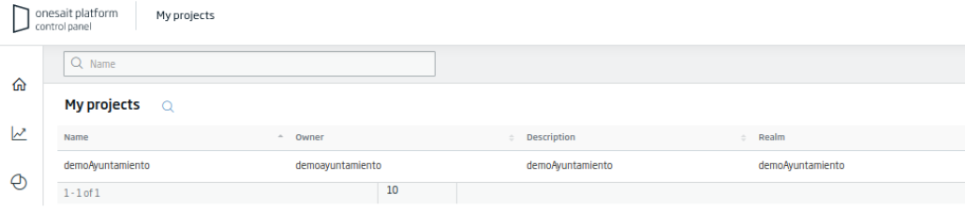
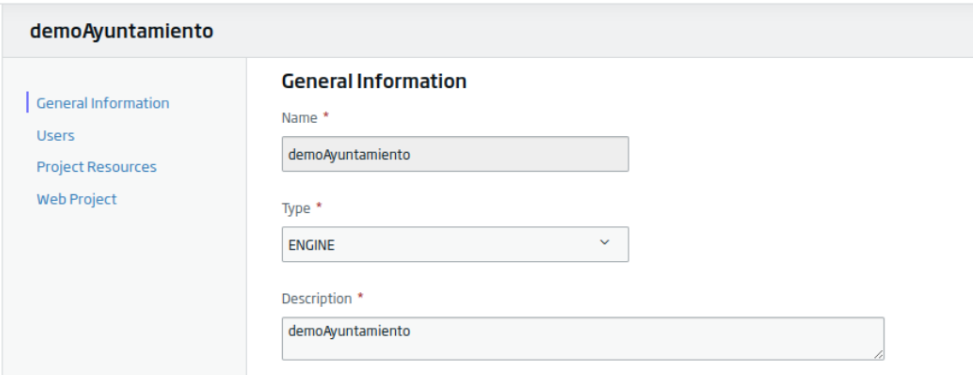
This project has general information:
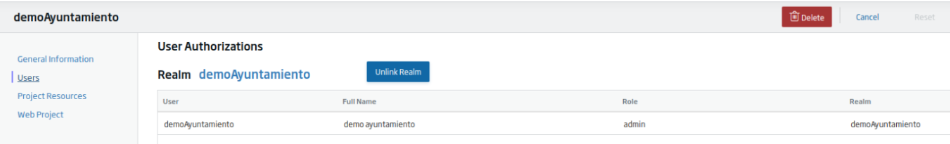
As well as a list of associated users and a Realm:
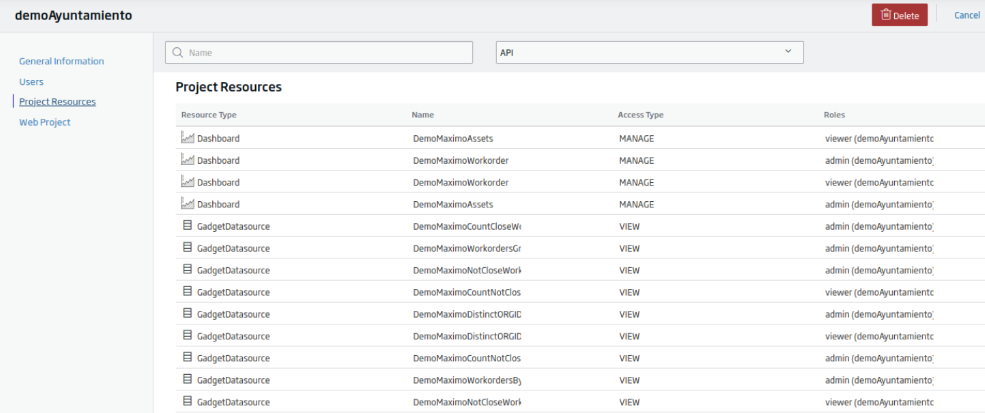
And finally, a list of resources, the roles that have access to them, and the type of access they have:
We hope you found it interesting, and if you have any questions about it, do not hesitate to leave us a comment. Also, if you are interested in us showing you this demonstration live, do not hesitate to contact us to make an appointment at our contact email contact@onesaitplatform.com.
Header Image: Kari Shea at Unsplash