Spring Boot Admin Server Use Guide
In a previous post, we saw what the Spring Boot Actuator consisted of, and how to add it to our service. However, we lacked a means to exploit all this information that it offers us, and for this we have Spring Boot Admin.
Spring Boot Admin offers you a control panel from which to see all the information and metrics that it allows you to do this, in a visual and clear way that is easily understood by the user. Besides, it offers you a notification system by Slack or email to notify you of outages in the services, all with a simple configuration in the services that you want to monitor.
How to use it from the Onesait Platform
Generate the module
First of all, generate the necessary modules using the Initializr, selecting the «onesait-app-monitoring» module from the list of modules, and indicating any name that will help us to recognize it. This will generate a ZIP file that will contain a project with the indicated name that you must discard, and a onesait-app-monitoring folder where you will find the module involved in the backend subfolder.
When uploading the service to Git, we recommend you add it from the backend folder, that is, be sure that the .git folder is inside the generated «backend» folder along with the «Readme» and the «sources» folder.
With this you would already have a service ready to be used and deployed on the desired machine.
CI
The module comes ready for deployment with the Docketfile, Jenkinsfile and other files for the CI; you only have to make a change in the Jenkinsfile to change the name of the image that is uploaded to the registry. If the default name is used, it may happen that it is overwritten with another version.
Jenkinsfile
You have to modify the stage of «build_img», specifically modifying this line:
img = docker.build("${projectPom.artifactId}:${projectPom.version}", "-f docker/DockerFile ./target")Once you have the image name changed and the pipeline, you can create your image and deploy it on the Rancher.
Rancher
Within the Rancher, configure it through environment variables, which are the following ones:
ADMIN_USER=<ADMIN_USERNAME>

ADMIN_PASS=<ADMIN_PASSWORD>

NOTIFY_SLACK_ENABLE=<SLACK_ENABLED>

NOTIFY_SLACK_URL=<SLACK_URL>

    NOTIFY_MAIL_ENABLE=<MAIL_ENABLE>

NOTIFY_MAIL_TO=<MAIL_TO> - <ADMIN_USERNAME>: username with which you will access the control panel.
- <ADMIN_PASSWORD>: password of the user with which you will access the control panel.
- <SLACK_ENABLED>: flag to enable Slack notifications.
- <SLACK_URL>: slack URL to send the notification.
- <MAIL_ENABLE>: flag to indicate whether you want to send email notifications or not.
- <MAIL_TO>: list of email users that will be notified; They must be separated by commas.
Only in the case of having activated email notifications, you must configure it with the SMTP server:
MAIL_HOST=smtp.gmail.com
MAIL_PORT=587
MAIL_USER= ***
MAIL_PASS=***
MAIL_SMTP_AUTH=true
MAIL_SMTP_TTLS_ENABLED=true
MAIL_SMTP_TTLS_REQUIRED=true
MAIL_SMTP_TIMEOUT=5000
MAIL_SMTP_CONN_TIMEOUT=5000
MAIL_SMTP_WRITE_TIMEOUT=5000
MAIL_SMTP_FROM=***
As an example, this is a configuration that works with Google’s free SMTP.
Nginx
Finally, to expose the control panel, once the image has been deployed in the Rancher, you must configure Nginx with the following:
nginx.conf

# Monitoring

location /app-monitoring {
   proxy_pass  http://app-monitoring.Monitoring:18100;
   proxy_set_header Host $http_host;
   proxy_set_header X-Real-IP $remote_addr;
   proxy_set_header X-request_uri "$request_uri";
   proxy_set_header X-Forwarded-For   $remote_addr;
   proxy_set_header X-Forwarded-Proto $scheme;
   proxy_set_header X-Forwarded-Port $server_port;
   proxy_set_header X-Forwarded-By $server_addr:$server_port;
}
Here, you will have to change the service and stack name in the proxy_pass to your own.
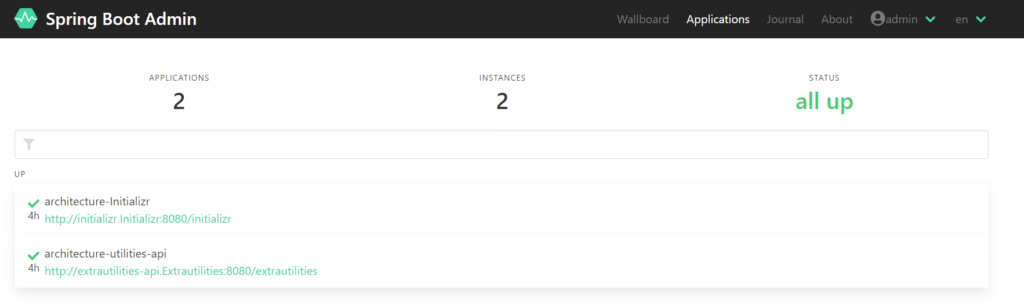
Next, we are going to show some screenshots to observe the control panel with two internal modules: Initializr and Extrautilities. Besides, some of the commented functionalities for the case of the Initializr are specifically described.
Main screen with the list of services, their status and the time they have been running:
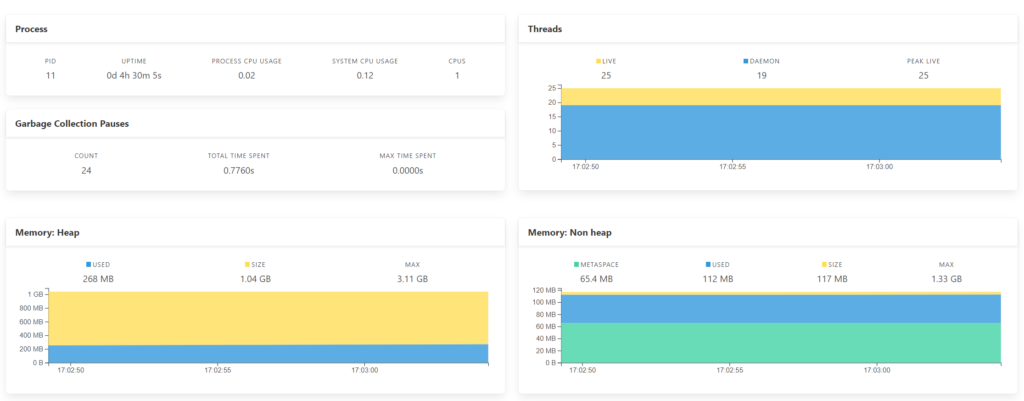
General service information:
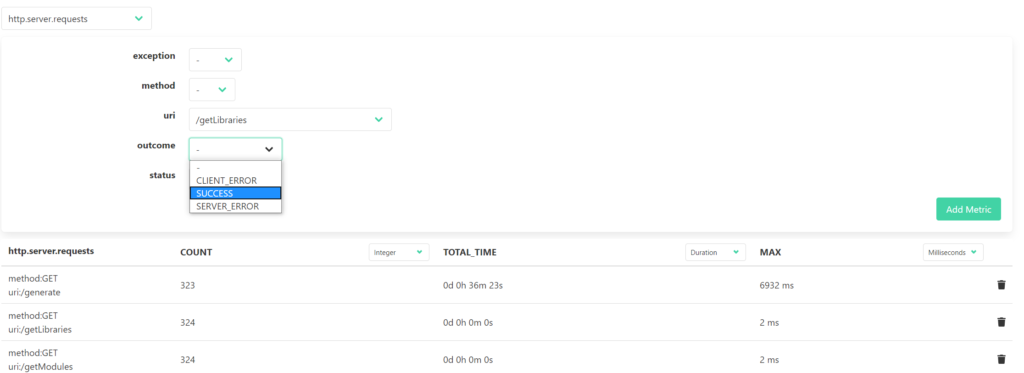
See metrics, such as number of calls to each endpoint and times (among others):
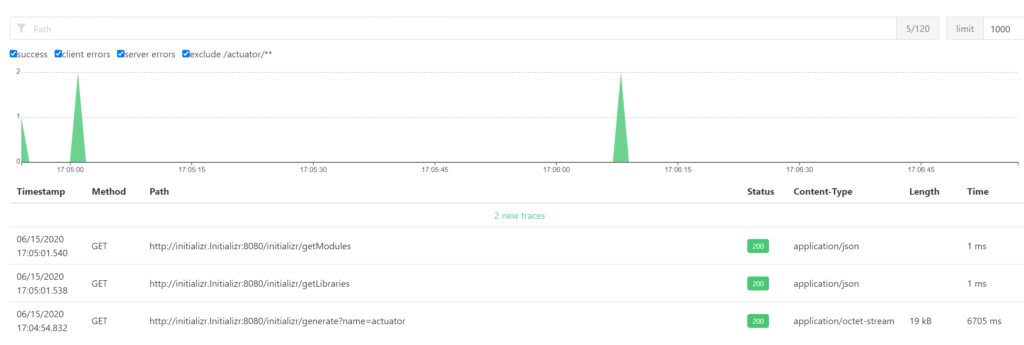
Real-time log of HTTP traces:
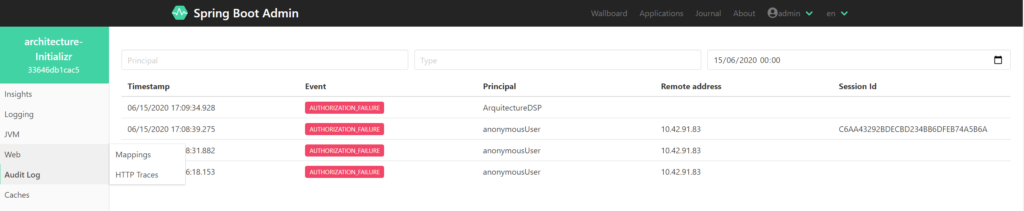
Log of audit events such as authorization failures:
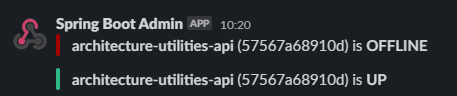
Slack notifications:
We hope you found it interesting, and if you have any questions, do not hesitate to ask us in the comments.
Header image: modified by Damian Zaleski at Unsplash.