
Fluentd Advanced Settings
Fluentd is the F in the EFG (Elastic-Fluent-Grafana) stack. In a nutshell, the use case that we propose for the reference framework is as follows: we will write a log in Fluentd from a certain artifact. This, after one or more filters or transformations, will write it in Elasticsearch. Once the information is indexed in Elasticsearch, we will visualize it graphically with the power that Grafana gives us.
In this post, we will go through some of the different possibilities that Fluentd offers within that EFG stack.
Basic information of a trace that is written in Fluentd and Elasticsearch
It is important to know the most important fields in the information structure that travels in a Fluentd trace. In the different strategies and setups described in this post, the following are often interesting:
- Tag: this is the main header under which the information that is going to travel will be indexed. It is made up of two parts separated by a period (.):
- Tag: the first part is called tag in the strict sense.
- Label: the second word is called label.
The combination of both, therefore, gives the value «tag.label». In the examples that we will see below, the tag will be «projectName» and the label will be «serviceName», so the traces in Fluentd and Elasticsearch will be headed by the example value: «projectName.serviceName».
The tag is very important to understand how information is filtered and transformed in Fluentd and how it ends up being indexed in Elasticsearch.
- Host: this is the name of the server on which Fluentd is running. In our examples, it will be «fluentdservice» – but this will not be very important.
- Port: it is the Fluentd port that is open on the server.
- Key: Fluentd adds some meta-information to the trace that it will write to Elasticsearch. At the same level as the fields of that meta-information, the so-called key is the one that will contain the message that we write from our application. By default, its value is «message», although it can be changed as will be described later. In our examples, we will assume that the message we want to write is in JSON format, which will also help us explain some of the filters that we add to the Fluentd configuration.
- Level: at the same level as the meta-information, there is also the level field, which indicates the logging level in which the trace has been sent (INFO, ERROR, DEBUG, etc.)
Writing strategies in Fluentd from Java
This entry is based on the experience we have gained due to the need to write distributed logs from several Springboot artifacts at the same time. Therefore, although the Fluentd configurations described are suitable for any technology that attacks it, the methods and strategies used will be described from a Java point of view.
The first thing we consider is whether we want to write in Fluentd through slf4j or natively. Either option has its pros and cons that must be considered. We will explain each of the two strategies and then make a comparative analysis.
Writing from logback
This is a typical slf4j strategy. The first thing is to add the necessary dependencies to the pom.xml.
<dependency>
      <groupId>ch.qos.logback</groupId>
      <artifactId>logback-core</artifactId>
      <version>1.2.3</version>
</dependency>

<dependency>
       <groupId>com.sndyuk</groupId>
       <artifactId>logback-more-appenders</artifactId>
      <version>1.8.0</version>
</dependency>
The «com.sndyuk.logback-more-appenders» library offers a logback appender to configure the «logback.xml», so that outputs are made to Fluentd:
<appender name="FLUENT_TEXT"

             class="ch.qos.logback.more.appenders.DataFluentAppender">

       <filter class="ch.qos.logback.classic.filter.ThresholdFilter">
             <level>INFO</level>
       </filter>
        <tag>projectName</tag>
        <label>serviceName</label>
        <remoteHost>fluentdservice</remoteHost>
        <port>24224</port>
        <useEventTime>false</useEventTime>

<messageFieldKeyName>message</messageFieldKeyName> <!-- This line can be omitted, since the default key is "message" -->
</appender>
In addition to the remoteHost and port parameters, which are self-describing, it is important to stress the importance of both tag and label. They will compose the tag that will index the trace in Fluentd, and later in Elasticsearch. As we have explained before, its composition will result in a value that will concatenate tag and label, separated by a period. In the example above:
projectName.serviceName The way we write to the Fluentd log via logback is equivalent to how we would write to STDOUT or to a file.
private final Logger logger = LoggerFactory.getLogger(this.getClass());

(...)

logger.info(message);

logger.debug(message);

logger.error(message);
From this moment on, if we have Fluentd started on the server ${fluentdservice} and port 24224, we should see in the Fluentd log how the log trace we are writing arrives. Later, we will see how to capture this trace, how to filter it, and how to redirect it to a store (in our use case, Elasticsearch).
Writing natively
In this case, we would not define an appender in logback dedicated to Fluentd. On the contrary, we have a library that provides us with a logger that establishes a connection with the Fluentd server.
The first thing to do is to add the dependency in the «pom.xml».
<dependency>
    <groupId>org.fluentd</groupId>
    <artifactId>fluent-logger</artifactId>
    <version>0.3.4</version>
</dependency>
Next, we can make use directlyof the FluentLogger factory as follows:
FluentLogger LOG = FluentLogger.getLogger("projectName", "fluentdservice", 24224);

(...)

LOG.log("serviceName", "message", message);
In this case, all the configuration and use are both programmatic. The factory receives the tag, the host and the port.
Later, in the call to the log method, the label, the key and the message are also sent to it.
This library’s API is very scarce. It only contains that «log» method.
When calling the method, if the Fluent server is started on the host fluentdservice and port 24224, you’ll be able to see in the console how the sent trace arrives (both the message and all the generated meta-information).
Advantages and disadvantages of the types of writing (Logback and natively)
Logback
- Advantages
- Use of the slf4j standard.
- Ease of use and versatility.
- Use of logging levels.
- Disadvantages:
- Being configured as an appender at the logback level, all the logs that meet the conditions established in the «logback.xml» file for the Fluentd appender, will be sent to Fluentd. Therefore, if the level is set to INFO, which is the usual option, all traces generated by Spring at startup or at any other time, as well as by any part of the application that at any time writes to the standard logger, will do it in Fluentd too. This overloads Fluentd and forces additional filters to discard sent traces that should not be sent to Elasticsearch.
- This is not a serious problem in low-concurrency environments – but, in high availability environments, it can overload Fluentd and completely fill the write buffers.
Natively
- Advantages:
- It fixes logback contra. That is to say: By programmatically writing only what we want, Fluentd has to work less, since it is less necessary to discard traces.
- Disadvantages:
- Overly simple API.
- It does not allow the writing of logging levels. That is to say, it does not send Fluentd an additional field to the meta-information that shows whether the message is an INFO, ERROR, DEBUG, etc.
- As a consequence of the above, it does not allow screening by levels, unless a manual mechanism is defined.
General Settings – fluent.conf file
Every Fluentd installation is governed by its fluentd.conf configuration file. It is a hugely versatile configuration, with many possibilities both in the CORE and in additional plugins. A small, yet important, part of this versatility is covered in this article, but let us insist on the usefulness of always relying on the official Fluentd documentation.
The fluentd.conf file is read and executed by the Fluentd engine, from top to bottom. We will describe next some of the most important parts of the file based on a real use case.
Source
Usually, the file starts with the <source> clause, that describes the received traces’s input source . It is the gateway to Fluentd. In our case, it is assumed that the traces arrive directly to the server through port 24224, and go directly to the following phases (lower blocks). This is called the input in_forward.
<source>
  @type forward
  port 24224
  bind 0.0.0.0
</source>
Another very used type of source is the @type tile, which foresees that the input traces are written to a file, and are subsequently consumed by another process that sends them to the following phases.
Regardless of the strategy chosen in the input, the versatility of Fluentd allows you to do things like adding a prefix to the tag with which the trace arrives from the Java artifact:
<source>
  @type forward
  add_tag_prefix prod # Añade el prefijo "prod" al tag original de la traza recibida.

</source>
Filter
The <filter> clauses allow you to filter the received traces in order to discard those that do not comply with an established format. They are also extraordinarily versatile. In the header of the clause, you can establish which tag is the one that must go through the filter. It also allows wildcards.
We describe below two uses that have been given in a real case.
The first described filter receives, as its input, the traces headed by the tags whose first part is the word «project» (following our initially established example). As you can see, if we have several services in our project, each of these services will send its own tag (for example project.serviceName1, project.serviceName2, etc.), and the filter will check the traces received from all of them thanks to the wildcard of the second part of the tag.
There are many types of tags. The one used in this case (parser) is very useful when we write a JSON. It is responsible for parsing the different fields found in the JSON structure, separating them into key-value pairs.
- @type: defines the type of filter.
- key_name: as we remember, the key field is the one that contains the primitive message sent from our Java artifact. The clause’s key_name parameter tells Fluentd the value of that key. In our case, this was the word «message».
- reserve_data (boolean): if set to true, it keeps the field with its <key_name> key and the value received in the trace. If set to false, it still parses its values to key-value pairs, but in the indexed trace, there won’t be an additional field whose key is <key_name>.
- remove_key_name_field (boolean): in each field resulting from the parsing and conversion to key-value pairs, it prepends the value of the <key_name> field to each of the keys that result from the parsing.
- The <parse> sub-clause tells the filter which method to use to parse the contents of the field. In our case, it is json, but it can have many other parsing proposals, including ad-hoc regular expressions.
<filter project.**>
  @type parser
  key_name message
  reserve_data true
  remove_key_name_field false
  <parse>
      @type json
  </parse>
</filter>
The next block introduces another filter. In this case, it is responsible for filtering using a regular expression or pattern. The @type is grep and the expression is responsible for matching and keeping only those messages that have the reserved word «inout». Everything else is discarded.
<filter project.**>
  @type grep
  <regexp>
    key message
    pattern /^.*inout.*$/
  </regexp>
</filter>
Match
The <match> clause is where Fluent is told what to do with the information resulting from everything done before. In our case, we want it to take the traces whose tag has the word «project» as a prefix, accepting all suffixes through the ** wildcard.
Besides, also in our case, we want it to do two things with the “winning” traces. We describe this below:
- @type copy: Using the “copy” value, we tell Fluentd that we are going to do more than one thing with the information. Each of those things are indicated in the <store> subclauses.
- <store>: indicates what to do with traces that meet the requirements.
- @type elasticsearch: here we tell the first store that the strategy to follow is a write in Elasticsearch. The possibilities of this plugin are very wide, and are described in its documentation.
- @type stdout: as you may imagine, it writes the traces to the console.
<match project.**>
  @type copy
  <store>
    @type elasticsearch
    host elasticdb
    port 9200
    logstash_format true
    logstash_prefix applogs
    logstash_dateformat %Y%m%d
    include_tag_key true
    type_name app_log
    tag_key @log_name
    flush_interval 1s
        user elastic
    password changeme
  </store>

  <store>
    @type stdout
  </store>

</match>
Buffer usage strategies
Fluentd contains a buffer into which winning traces are written. It is divided into «chunks». According to a fully configurable policy in terms of times, cycles and sizes, these chunks are dumped to the output stores. Once again, we recommend the official Fluentd documentation to learn first-hand the possibilities offered by different buffering strategies in Fluentd. Nevertheless, we will broadly describe the two large existing groups according to the chosen strategy: in memory and in file.
In this section of the Fluentd documentation, all the parameters that modify the strategies to follow are exhaustively described.
File buffer
To configure the file buffer, in the <match> section, the following must be defined at the <store> level:
<buffer>
    @type file
    path /var/log
</buffer>
The unique parameter «path» indicates the path where the logs will be written. Bear in mind that, for each chunk, two files will be written: the log itself and a meta-information file with control data of the corresponding chunk.
This strategy is easier to monitor, as the growth and rotation of the chunks can be monitored live. If they start to grow, then the strategy is a wrong one, since Elasticsearch is not able to swallow the entire output stream that Fluentd is emitting fast enough.
Memory buffer
This is the default setting. Chunks are stored in memory. This fact makes the size of the default chunks, and their emptying times and cycles, much smaller. This strategy is much more difficult to monitor, since there is no physical file writing. In the event that the maximum buffer size is exceeded, for example, we will find out only when the error has already occurred.
High availability configuration
In high concurrency environments, we highly recommend to carry out a high availability configuration, which is, as usual, very well described in the official Fluentd documentation.
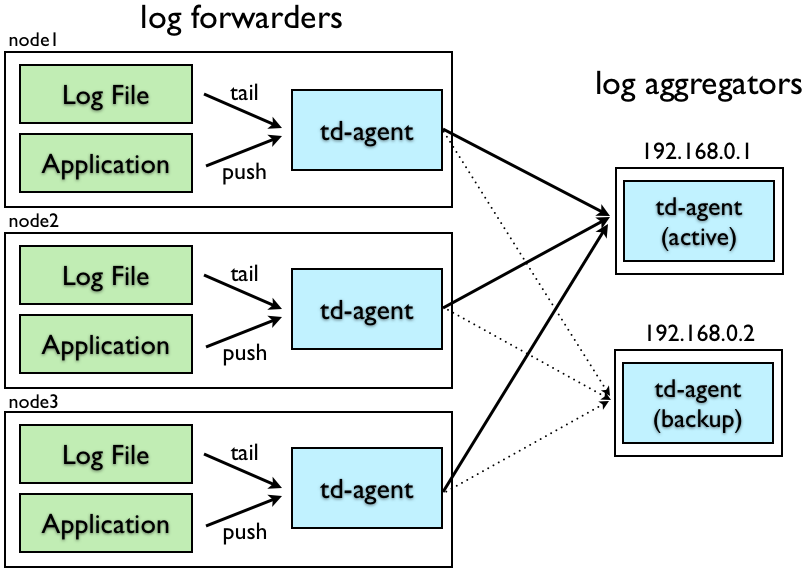
In this type of configuration, two types of nodes are established: log-forwarders and log-aggregators. In reality, this strategy is nothing more than a «division of tasks.» The log-forwarders do all the work that the upper sections (source and filter) do, while the log-aggregators do the work described in the output (match) section.
Log-forwarders
As said, the forwarders simply receive the traces, filter them and, once filtered, they replace whatever is inside the <match> clause, with a simple forward to as many <servers> as log aggregators have been configured. In the diagram example, there are two, so the configuration would be:
<source>
  @type forward
  port 24224
  bind 0.0.0.0
</source>

<filter project.**>
  @type parser
  key_name message
  reserve_data true
  remove_key_name_field false
  <parse>
      @type json
  </parse>
</filter>

<filter project.**>
  @type grep
  <regexp>
    key message
    pattern /^.*inout.*$/
  </regexp>
</filter>

<match project.**>
    @type forward
    <server>
        host fluentd-a1
        port 24224
    </server>

    <server>
        host fluentd-a2
        port 24224
        standby
    </server>
</match>
As you can see, in a log forwarder, all the configuration is exactly the same except for the <match> clause. This means that everything regarding the origin of the traces and the subsequent transformation and filters to achieve the «winning» traces, is exactly the same as in a single node configuration.
However, in the clause, which is set to @type forward type, two servers are configured, the second of which is registered with the reserved word «standby». This indicates all selected traces are sent, without further checks, to a log-aggregator «fluentd-a1». When it dies, the traces are sent to the log-aggregator «fluentd-a2».
Log-aggregators
As you can imagine, the log-aggregators simply receive the traces from the log-forwarders, and do the work that the <match> clause did in the single-node configuration. It is done through this configuration file:
<source>
  @type forward
  port 24224
  bind 0.0.0.0
</source>

<match project.**>
  @type copy
  <store>
    @type elasticsearch
    host elasticdb
    port 9200
    logstash_format true
    logstash_prefix applogs
    logstash_dateformat %Y%m%d
    include_tag_key true
    type_name app_log
    tag_key @log_name
    flush_interval 1s
        user elastic
    password changeme
  </store>

  <store>
    @type stdout
  </store>

</match>
That is to say: all the received traces go directly to the , which writes them in Elasticsearch and outputs them to the standard output.


Pingback: Configuration in Kubernetes – Onesait Platform Community
Pingback: Good practices in Grafana – Onesait Platform Community