Onesait Platform vs. ThingWorx (Part IV)
This is the fourth and last entry in the Onesait Platform vs. Thingworx series. Our objective is to make a comparison of the use of two IoT platforms – the Onesait Platform and ThingWorx. To do this, we will perform a hands-on test following a simple IoT flow where we will simulate a building with devices to read its energy consumption and temperature. Finally, we will create a dashboard to visualize this information.
In order to get a better understanding of this comparison, we have structured the steps to follow, common to both platforms, in four entries:
- Registration and Login. Data modelling.
- Connect your device.
- Simulate input data.
- Create Applications.
Today we will see the last point.
Create Applications
Onesait Platform
Once data exists on the Platform, and as devices or other applications connect to the Onesait Platform, it is possible to create applications that interoperate with each other and exploit the existing information. The Onesait Platform’s Visualization Tools allow the information stored within the Platform (Ontologies) to be easily and graphically exploited. You can create unitary visualization elements (Gadgets) and gather them in a web page (Dashboard).
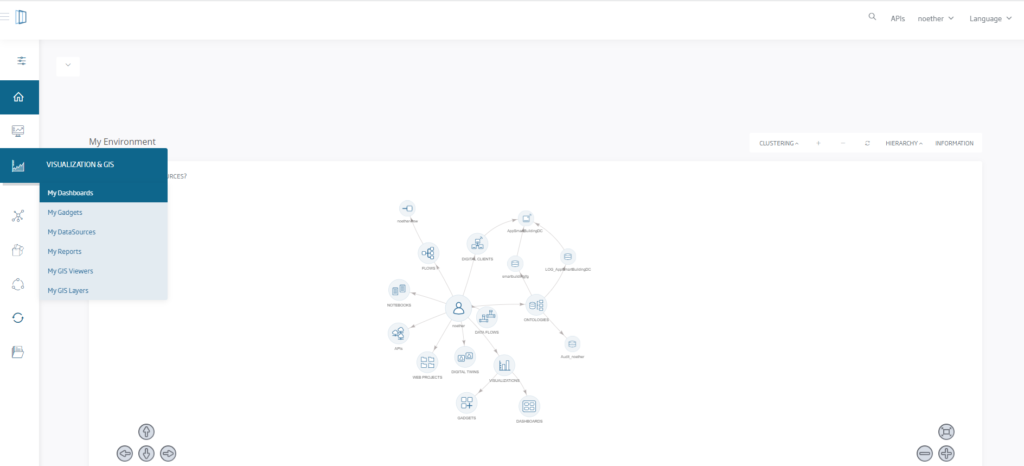
The next step is to create a dashboard using the platform’s graphic presentation capabilities. To create your first gadget, click on Visualization & GIS > My Gadgets.
Then click on «New» and start creating the gadget. First, create a counter that will tell the last power measurement inserted on your ontology. To do so, choose your ontology in the drop-down menu and copy the following query in the queries section:
select c.smartbuildingjfg.watts, contextData from smartbuildingjfg as c order by contextData.timestampMillis desc limit 200
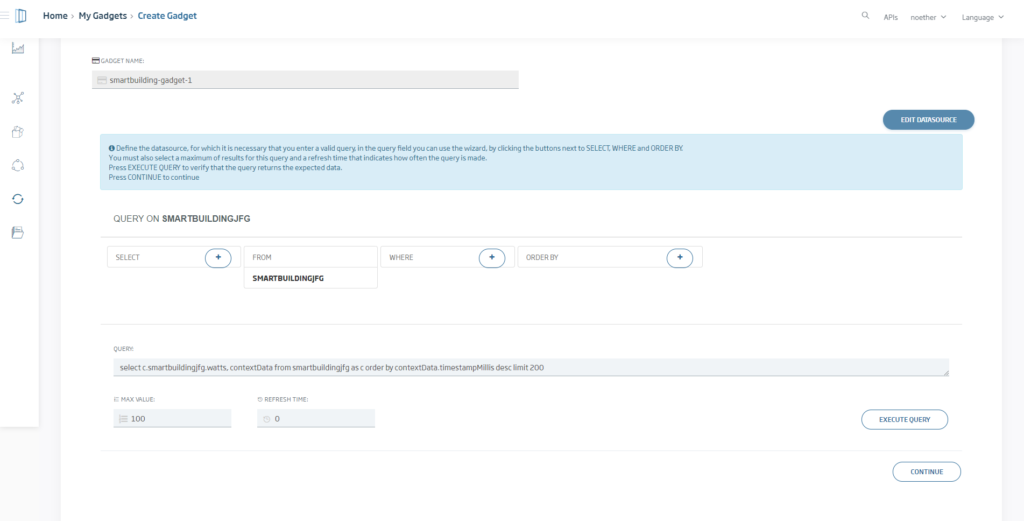
Click on continue after checking that the query is working properly with the «Execute Query» button. This will take you to a screen where you can choose the type of Gadget you want.
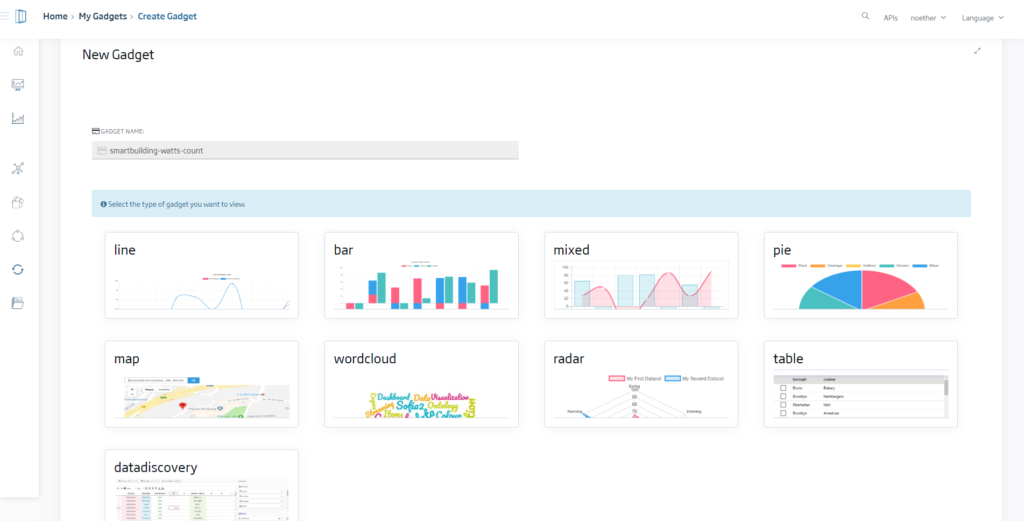
Choose the line type and link the X axis to the contextData.timestamp field, and the Y axis to the power measurement.
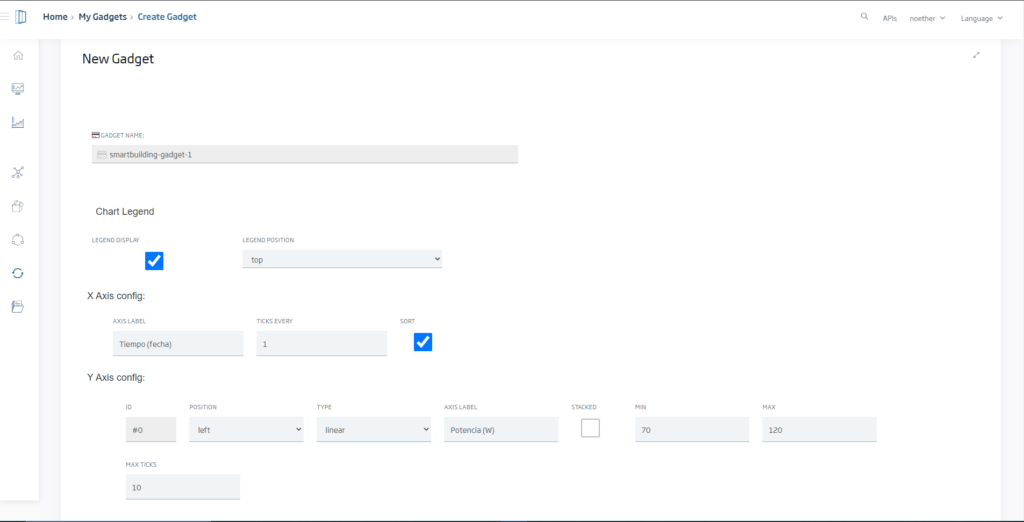
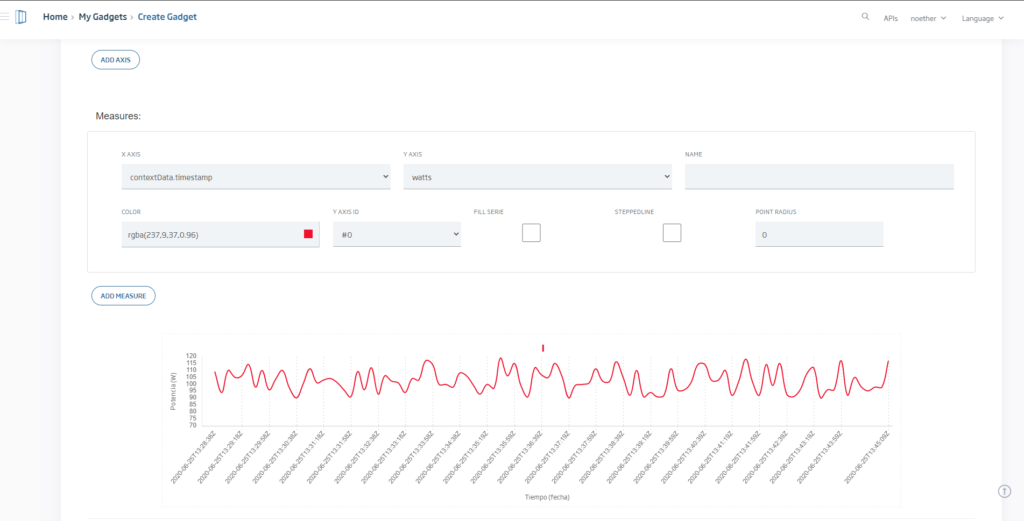
Click on «New» and you have created your first Gadget!
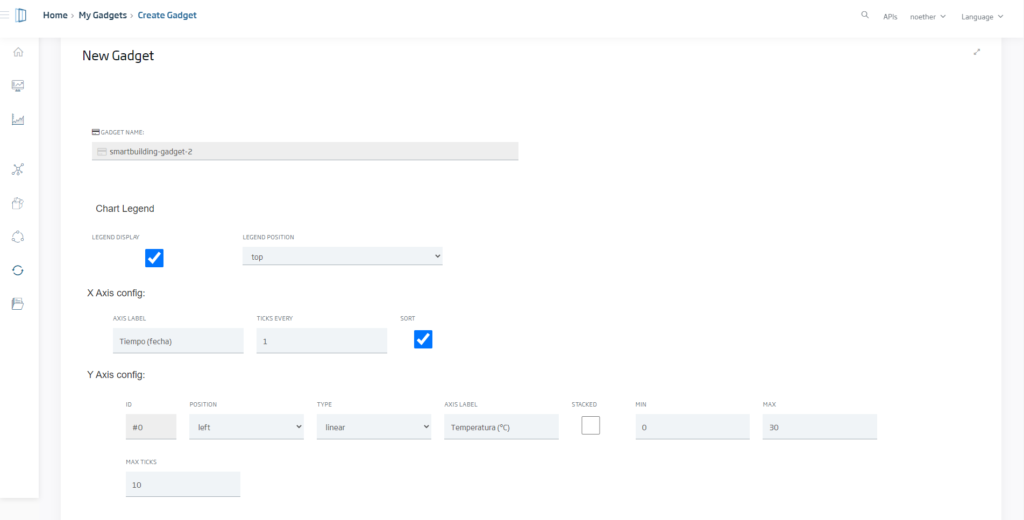
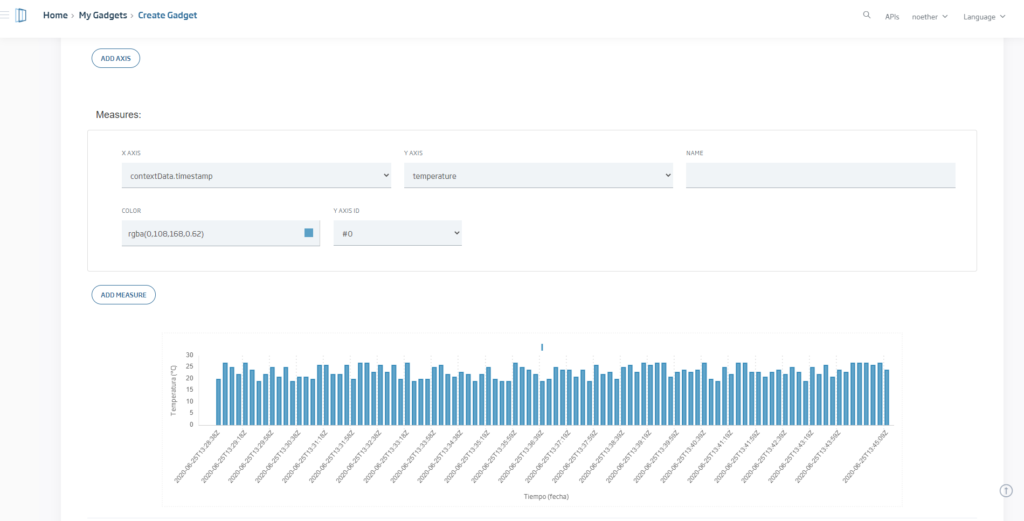
Repeat the process, this time choosing the bar gadget type and as a query enter the following one:
select c.smartbuildingjfg.temperature, contextData from smartbuildingjfg as c order by contextData.timestampMillis desc limit 200
Lastly, we will create a map gadget to locate the device. To do this create a new gadget and this time choose as a type the option map. Fill in the query field with:
select c from smartbuildingjfg as c order by contextData.timestampMillis desc limit 1
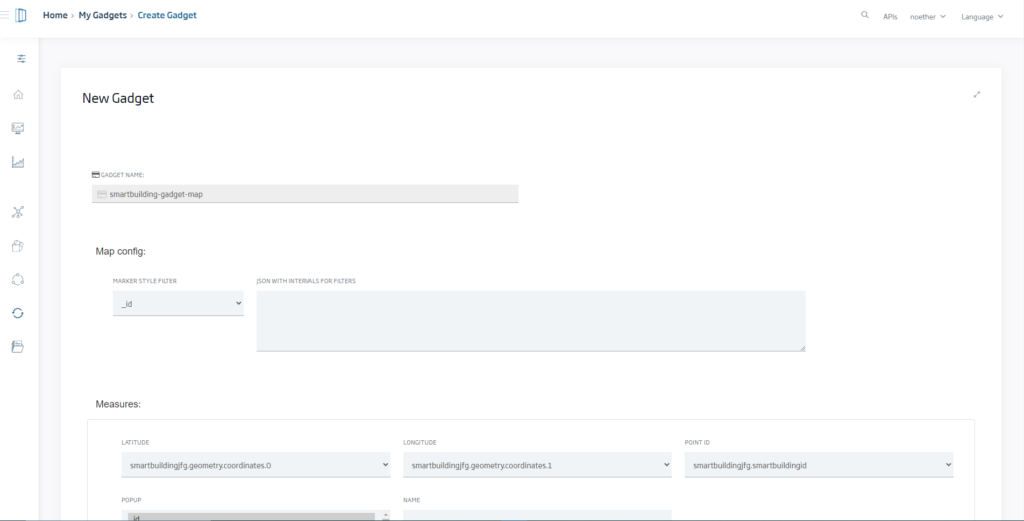
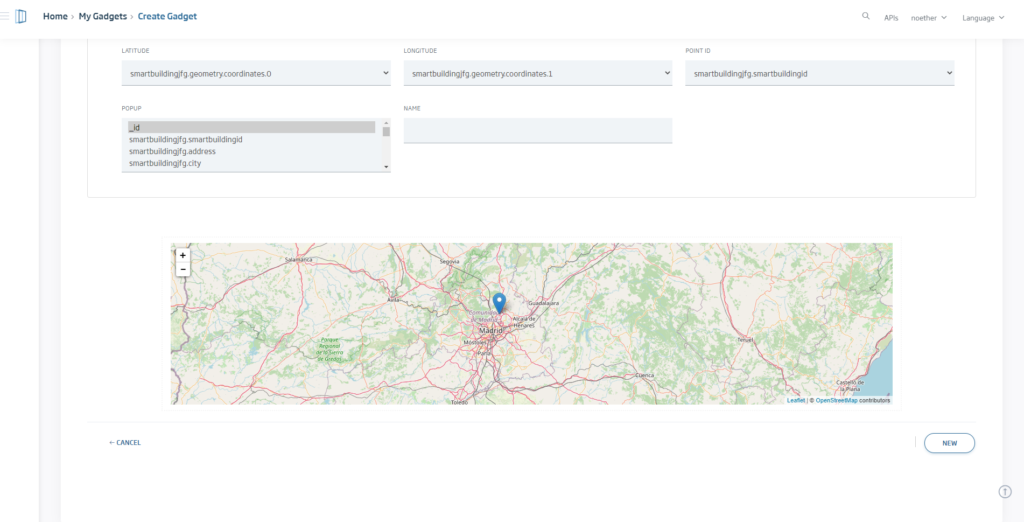
Choose the property coordinates.0 as latitude and coordinates.1 as longitude.
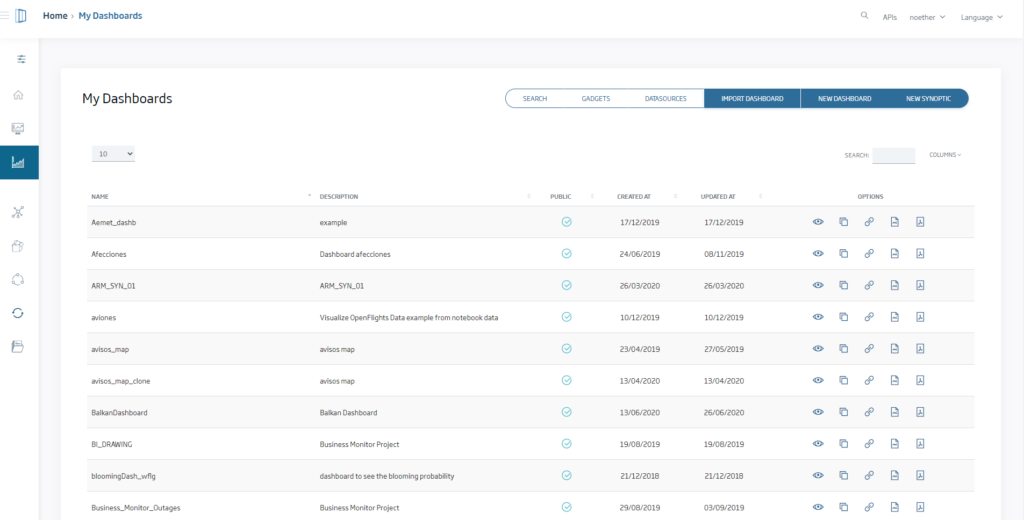
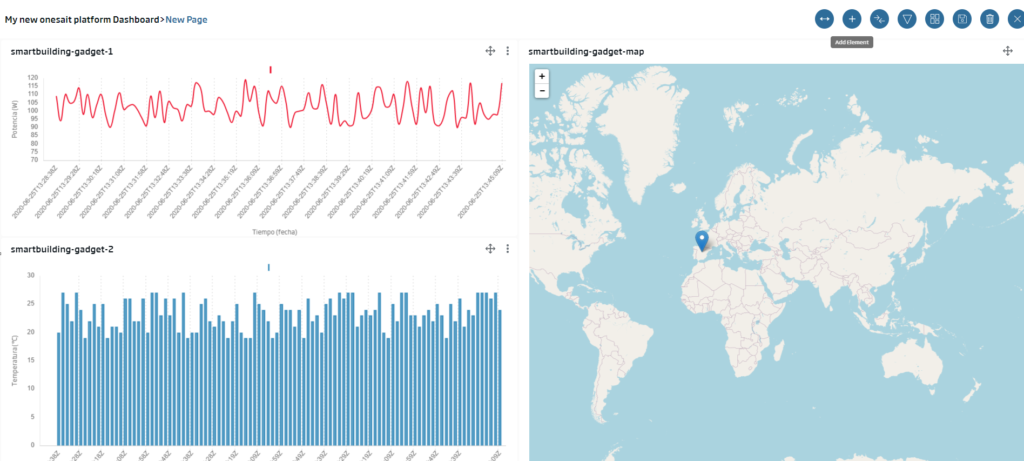
At this point you already have three Gadgets: a line graph that represents the power versus time, a bar graph that tells the temperature at each moment and a map that locates the device. Now let’s add these Gadgets to a Dashboard and finally assemble your application.
To do so, place yourself on the Dashboards screen and click on «New Dashboard».
This will take you to a screen where you have to choose the name, styles and authorization for the dashboard. In this case choose the default style and no authentication.
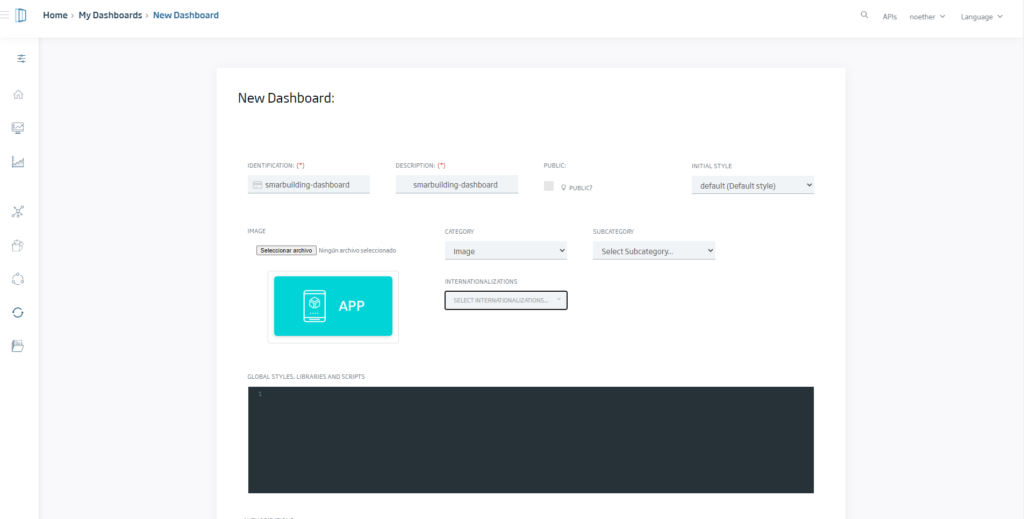
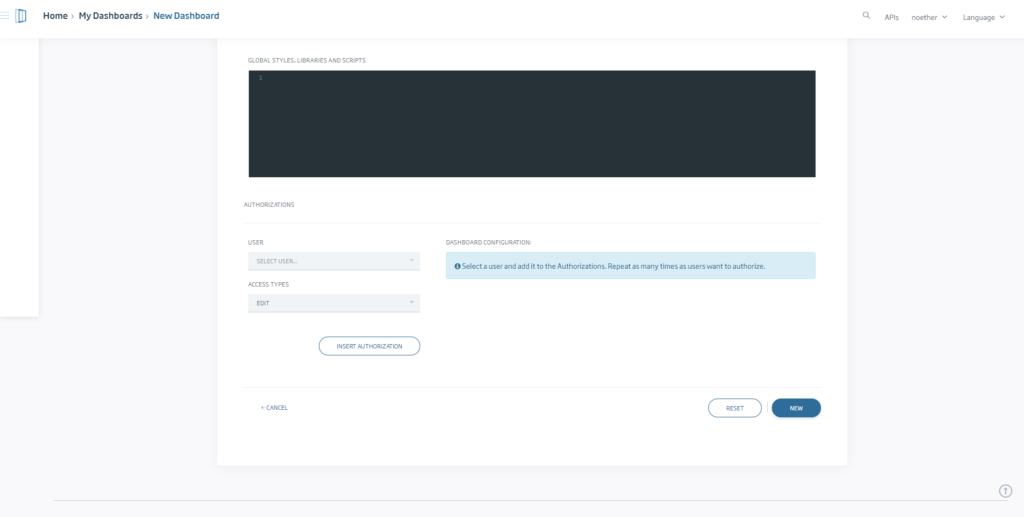
When you click on «New» it will take you to your upcoming Dashboard. From this screen, you can add the Gadgets that you have previously created by clicking on «Add Element», then drag each element to your Dashboard. You will have the option to create a new Gadget or add the ones you have already created.
ThingWorx
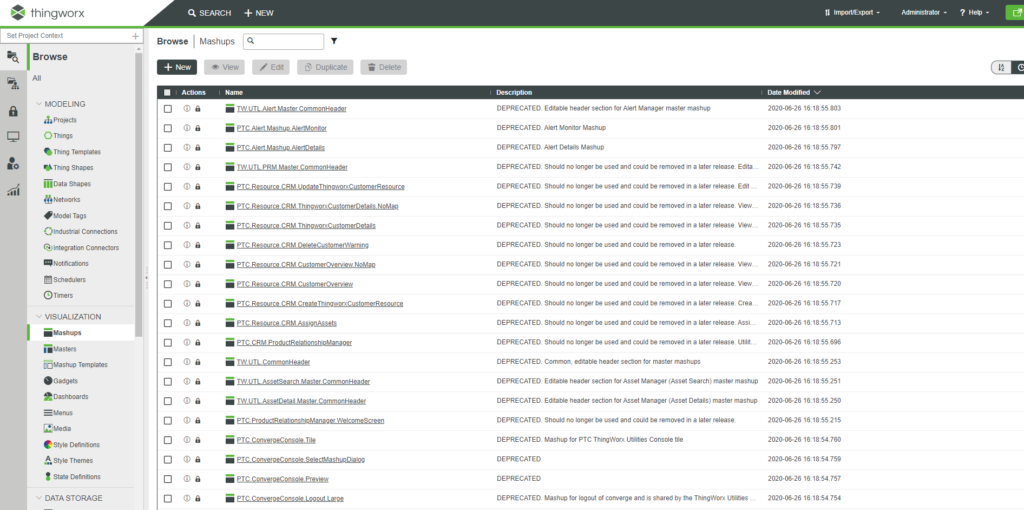
ThingWorx denomina Mashup Builder al lugar donde se crean las visualizaciones, siendo los widgets los componentes que se colocan en el mashup. Por lo tanto, podríamos establecer la siguiente similitud de conceptos: lo que llamábamos Gadget en la Onesait Platform, en ThingWorx es un widget y lo que llamábamos Dashboard, ahora es un Mashup.
Para empezar, nos situamos encima de la pestaña Mashups, en el panel de la izquierda y pulsamos en «+ New».
Choose the static type and fill in the «Name» y «TAG» fields.
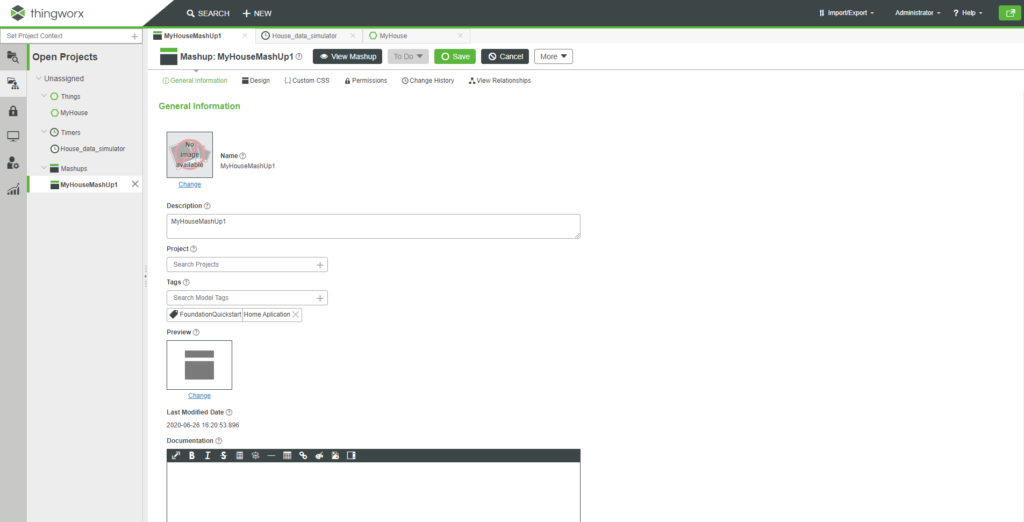
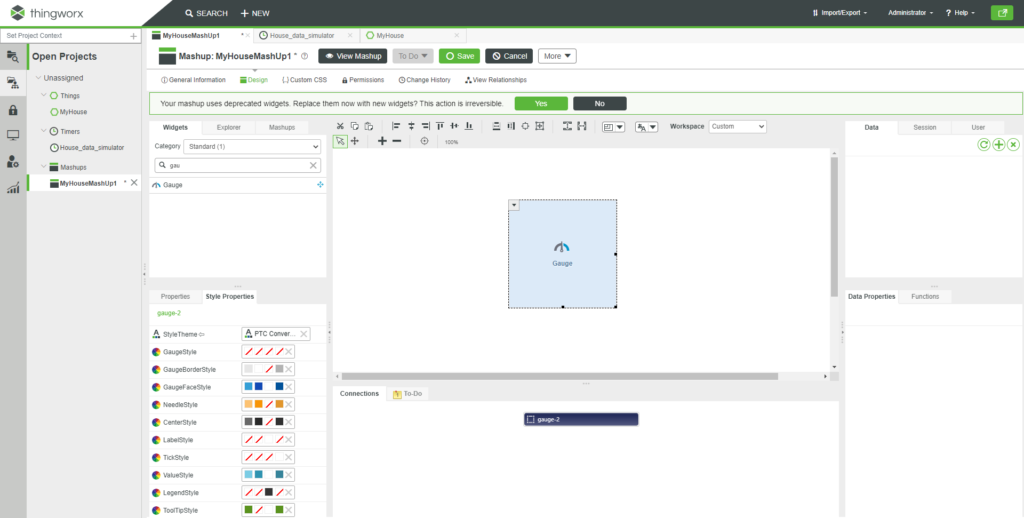
Click on «Design» and a box will appear where you can drag the different types of widgets. In this case, choose a Gauge type widget. You can edit its name from the Properties tab.
If the Google Maps Widget 3.0.3 is not available, download and install the Open Street Map Extension from ThingWorx IoT Marketplace.
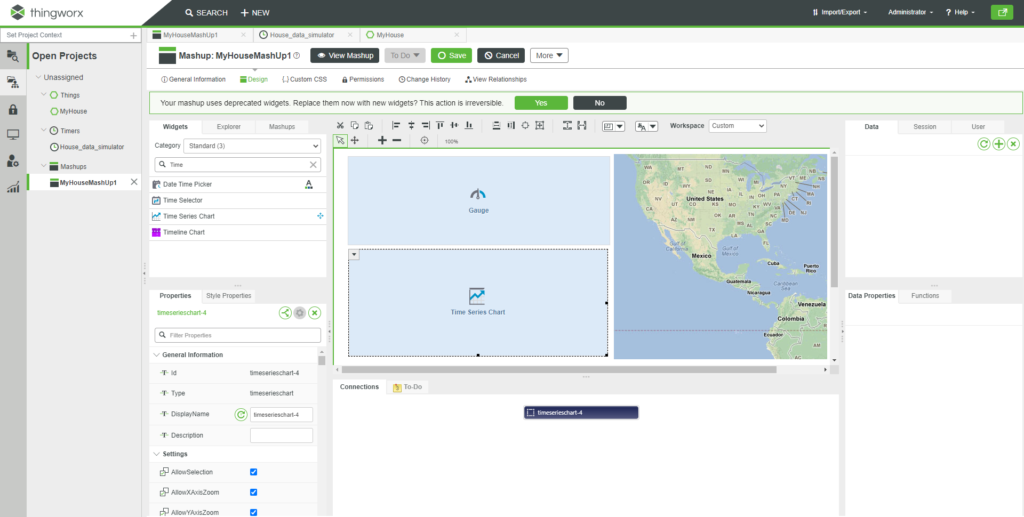
Click and drag the Google Maps Widget 3.0.3 onto the canvas in the center. Click and drag the Time Series Chart widget on the canvas. Move the widgets and resize them to fit the canvas.
To add data to the mashup we must click on «+», in the data table in the upper right corner.
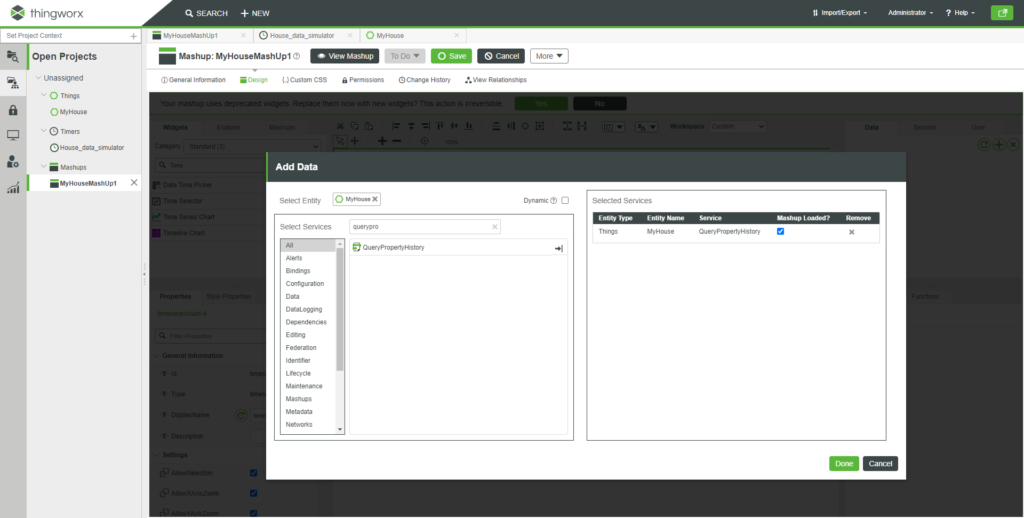
When you do this, a window will appear in which you can choose between different services. Choose «QueryPropertyHistory». Click on the «check» in MashUp loaded, and then on «Done».
To link the data to the widgets, open the drop-down menu to the right, and drag the Watts property onto the gauge widget on the canvas.
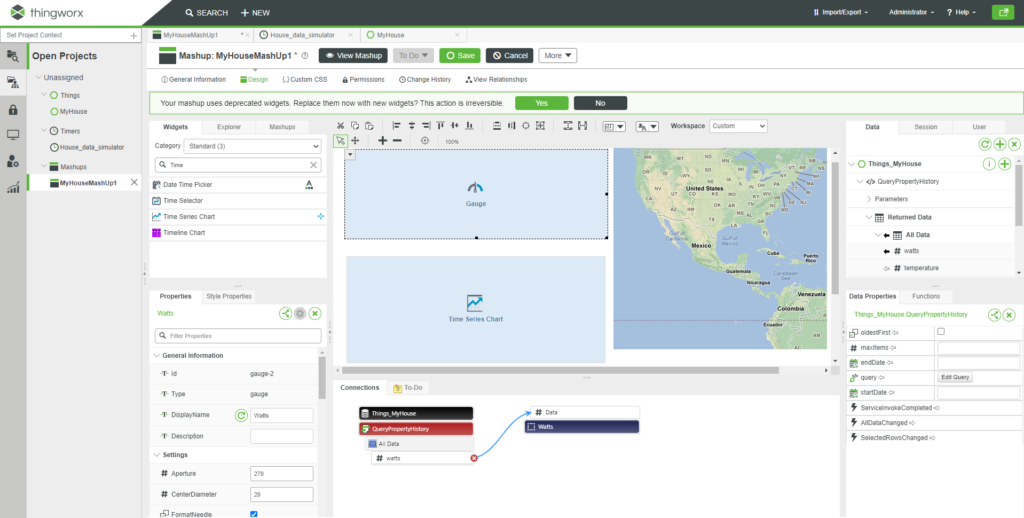
For the map, the process is similar, except that you must choose the property that gives the position. You will also have to add data, otherwise the creation will fail.
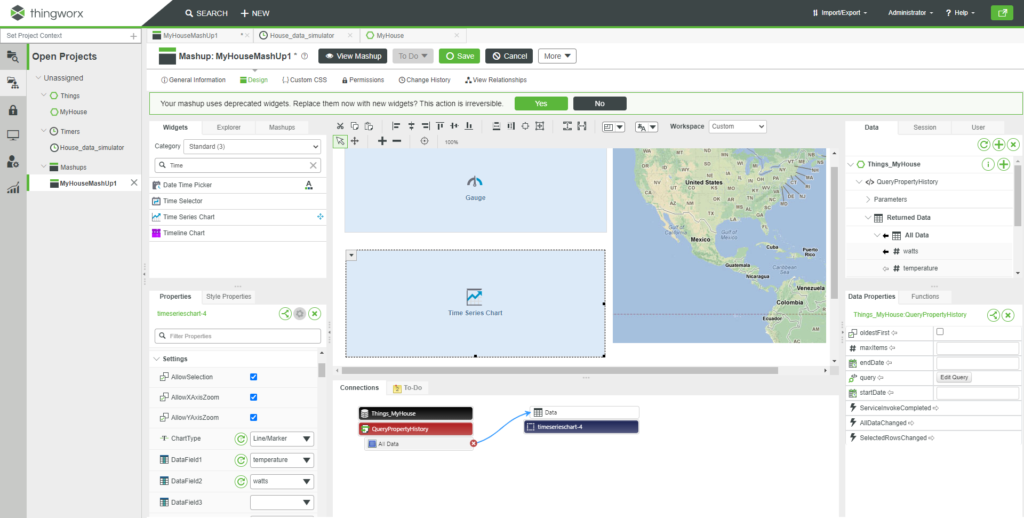
In the case of the Time Series Chart widget, choose all the data («All») instead of just the power. You must also choose the properties that you want to see displayed in the settings table in the bottom left hand corner.
Once finished, click on «Save» and «View MashUp», which will show us the result.
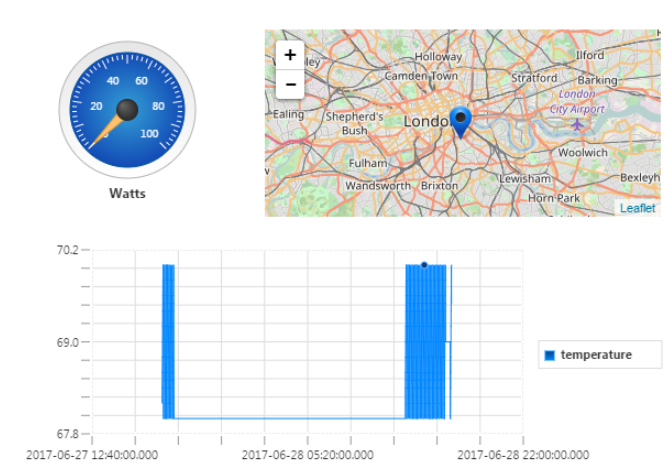
And this was the last post of the series. If you’ve successfully reached the end, you have been able to create a data model, connect it to a virtual device, populate it with data and then display it in a small app.
I hope you liked it and I’ll see you in further posts! 🙂