How to integrate external application metrics in the advanced monitoring of the Onesait Platform?
Today we are going to see how an external application can be configured so that its execution metrics are stored and displayed with the monitoring tool used by the Onesait Platform.
As a requirement to be able to use the functionalities described in this guide, we need to have the Platform monitoring module deployed and correctly configured.
If you do not have an Enterprise type Platform, you can follow this guide using the Community version of the Onesait Platform, which you can download completely free from our GitHub repository.

What tools do we use?
The monitoring of the Onesait Platform is based mainly on two technologies, Prometheus and Grafana.
Prometheus is a widely used timeseries database for monitoring metrics.
On the other hand, Grafana is a tool that allows you to create dashboards by configuration and that, in the same way as Prometheus, is widely used in monitoring systems and software, so it has a good base of ready-to-use dashboards created by its community.
Besides, since the Onesait Platform is deployed with Kubernetes, Prometheus and Grafana Operator are used, which makes it easy to deploy and configure Prometheus and Grafana on Kubernetes.
Bear in mind that the purpose of this monitoring tool is to have metrics of the software deployed in the Kubernetes cluster; by default, the metrics of the Onesait Platform modules, and as we will see in this article, also the metrics of other applications. This does not replace the hardware or network monitoring that exists in an installation.
Application configuration
In this post we are going to see a typical configuration case for external applications. Specifically, we will see how to store the metrics in Prometheus and how to display them in Grafana considering that the monitoring module of the Onesait Platform is being used, which makes these services available and configured.
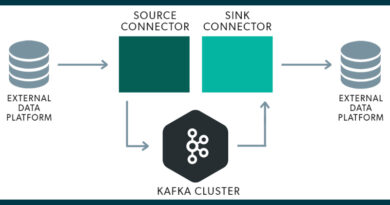
Prometheus gets metrics from applications directly, so applications need to enable a URL where they can query the metrics. This action is known as «scrape» in Prometheus. If a third party application does not enable the metrics in a format that Prometheus can use, there are several alternatives to incorporate them. The easiest one is to deploy an agent, which in Prometheus terminology is called an «exporter», which transforms the metrics from the format used by the application to a format accessible to Prometheus.
In this case, we are going to do an example with a Spring Boot application. Specific. we are going to use the Petclinic sample application that anyone can get from the Spring project repository.
In the case of Spring Boot, it does natively support enabling an «actuator» with the metrics generated for Prometheus. By default, this project already has the actuators configured. In Spring Boot, actuators enable endpoints with information and commands for application operation.
If you do not have them enabled, you must add the following dependency to the project’s «pom.xml» file:
<dependency>
     <groupId>org.springframework.boot</groupId>
     <artifactId>spring-boot-starter-actuator</artifactId>
</dependency>
In Spring Boot 2.x, this dependency alone is not enough to have metrics in the format expected by Prometheus, since the actuator for Prometheus is not part of the default enabled actuators and requires an additional dependency.
<dependency>
     <groupId>io.micrometer</groupId>
     <artifactId>micrometer-registry-prometheus</artifactId>
</dependency>
Once these changes have been added, just start the application and test that the Spring Boot actuator has been created correctly. Assuming the application is running on the local machine, and on port 8080, you can easily test the service by making an HTTP GET request to the URL:
http://localhost:8080/actuator/prometheusYou can use either a browser or a curl or Postman type tool, and the result will be something similar to the following text:
# HELP application_started_time_seconds Time taken (ms) to start the application
# TYPE application_started_time_seconds gauge
application_started_time_seconds{main_application_class="org.springframework.samples.petclinic.PetClinicApplication",} 6.177
# HELP logback_events_total Number of events that made it to the logs
# TYPE logback_events_total counter
logback_events_total{level="warn",} 0.0
logback_events_total{level="debug",} 0.0
logback_events_total{level="error",} 0.0
logback_events_total{level="trace",} 0.0
logback_events_total{level="info",} 18.0
...
For the case of metrics, we recommend not to configure security and limit network access so that obtaining the metrics has the least possible impact on application performance. In the case of Kubernentes, typically they are only accessible from within the cluster and, if it is necessary to further limit access, «Network Policies» can be used.
Create a Docker image of our project
For this example, we are going to package our sample application in a Docker container that we will use to deploy to Kubernentes. Each project will use its own configurations to package the code. In this part, we are going to create a basic configuration so that we can follow the example about the Petclinic project.
First of all, clone the source code of the application from the corresponding repo:
git clone https://github.com/spring-projects/spring-petclinic.gitHaving done that, you have to generate the JAR with the application. To do this, go to the root of the project and execute the following:
mvn clean packageThis should have created the JAR file in the project directory.
Next, to create the Docker image, use the following Dockerfile created in the root of the project:
FROM openjdk:11.0.1-jre-slim-stretch
EXPOSE 8080
ARG JAR=spring-petclinic-*.jar
COPY target/$JAR /app.jar
ENTRYPOINT ["java","-jar","/app.jar"]
To make this tutorial easier to follow, you can use the Docker image «onesaitplatform/example-monitoring-spring-boot:v1.0» that is hosted on DockerHub.
Prometheus configuration
Once your app is properly configured to export metrics, you need to configure Prometheus to fetch those metrics.
Since we are using Prometheus Operator, all configuration is done with «yalm» files, like any other Kubernetes cluster resource, making it easy for this configuration to be included in any automated deployment process or in a Helm chart.
There are several ways to tell Prometheus where to look for metrics, but in most cases configuring an element called «ServiceMonitor» will suffice. This component will tell Prometheus the necessary information to obtain the metrics.
Below is shown the ServiceMonitor for our sample application:
apiVersion: monitoring.coreos.com/v1
kind: ServiceMonitor
metadata:
  name: example-monitoring
  namespace: examples
spec:
  endpoints:
  - path: /actuator/prometheus
    targetPort: 8080
  namespaceSelector:
    matchNames:
    - examples
  selector:
    matchLabels:
      application: app-for-monitoring
  targetLabels:
  - application
In this case, we are configuring a Service Monitor in the «examples» namespace, which is where we have deployed the example application, to group the resources in that namespace.
The next thing we are going to configure is the endpoint where Prometheus can obtain the metrics, which in this case is in the path «/actuator/prometheus» and in port 8080, which is the one in which we are exposing within the cluster in the service of our example app.
To identify the service to get metrics from, we are filtering by namespace («examples» in this case), and by labels. Keep in mind that we are selecting a service, so the labels must be configured in the service and they do not need to be in the deployments. Prometheus will fetch metrics from all pods pointed to by Prometheus with no additional configuration required.
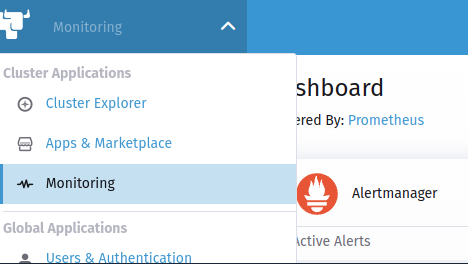
You can deploy a Service Monitor in Rancher from the Cluster Explorer > Monitoring menu (monitoring must be previously configured):
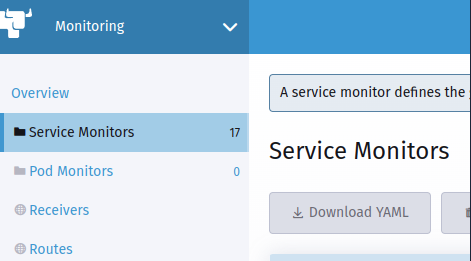
Next, choose the «Service Monitors» option and create a new «Service Monitor» using the «yaml» file.
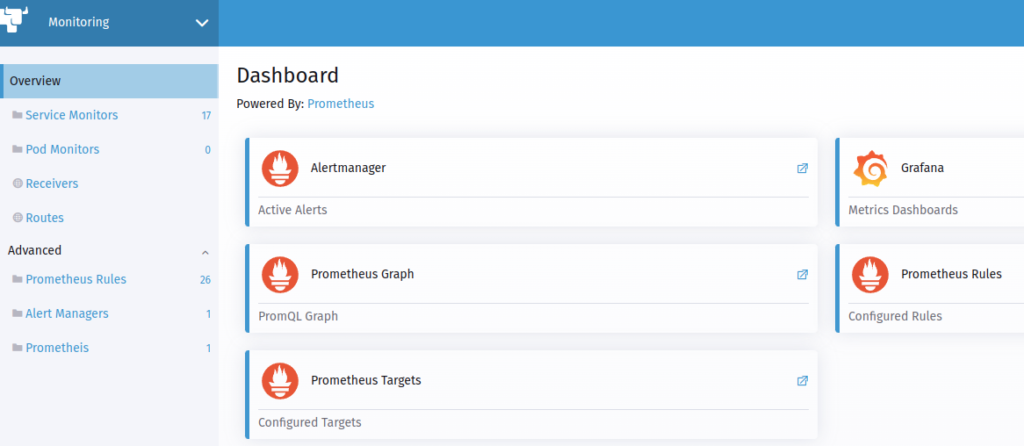
Once this component is created, and after a minute or two, you can check whether Prometheus has been able to obtain metrics from your application or not. The first place to check will be the «Targets» of Prometheus. These can be seen in Cluster Explorer > Monitoring > Overview > Prometheus Targets.
In the list of connected services, you can see the one you just created and its status.
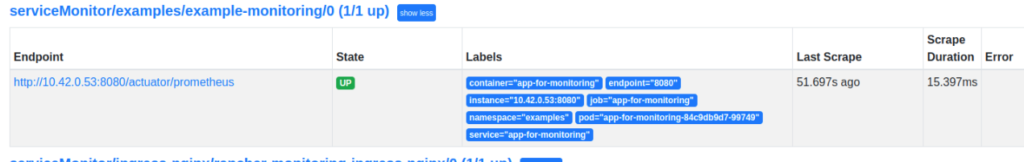
Once it is in the «UP» state, Prometheus will already be collecting metrics from our program. These can be consulted using a query from the Cluster Explorer > Monitoring > Overview > Prometheus Graph option.
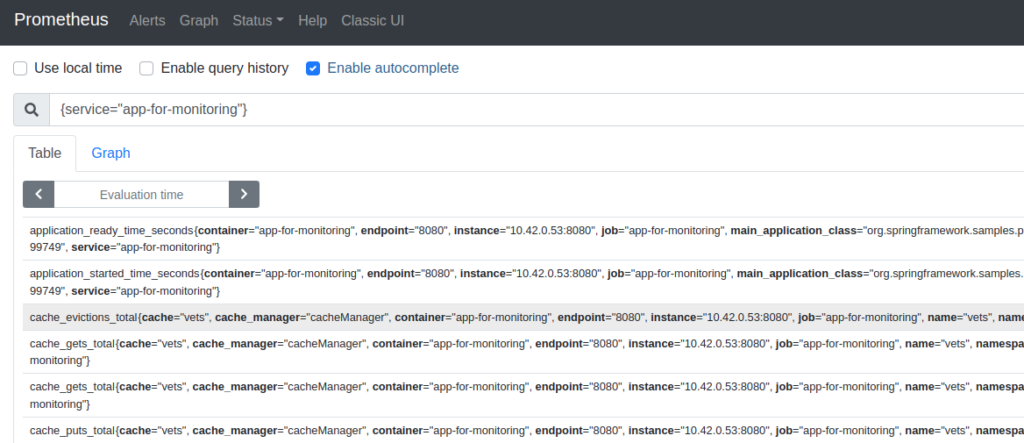
By default, Prometheus will collect metrics every minute and they will be kept in Prometheus for a limited amount of time depending on how monitoring is configured in the particular environment. Obviously, longer retention time means more disk space.
Grafana Configuration
Well, now that you have the metrics stored, let’s see how you can visualize them. Although they can be seen through queries directly to Prometheus, the usual way is to define dashboards that show the most relevant metrics in which you are interested.
Grafana is configured by default without persistence, so that all the configuration is in Kubernetes «ConfigMaps». This has several advantages, but the main one is that the configuration of the dashboards themselves can be done in the same application deployment using, for example, Helm.
In the case of Spring Boot, there is already a dashboard that shows the metrics for these applications:
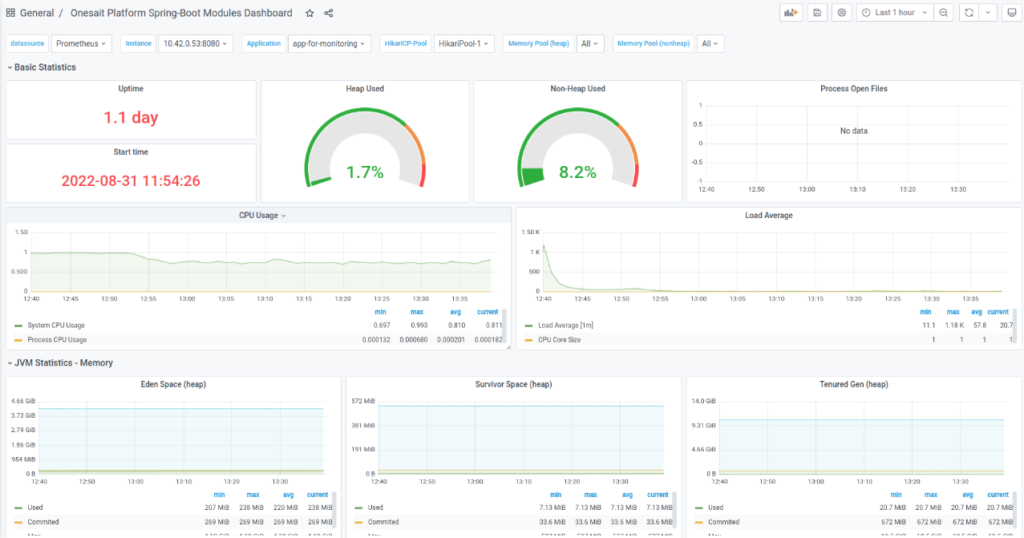
If what you want is to create a new dashboard, you can do it very easily by creating a new dashboard in the usual way in Grafana, either from scratch or by importing an existing one. Once you have the dashboard ready, all you have to do is export it as JSON format and create a «yml» to create a «ConfigMap» using the JSON:
apiVersion: v1
kind: ConfigMap
metadata:
  labels:
    grafana_dashboard: "1"
  name: name-of-your-dashboard
  namespace: cattle-dashboards # Change if using a non-default namespace
data:
  name-of-your-dashboard.json: |-
    {
    ...
    }
With this, Grafana will automatically create the dashboard without the need to restart anything. It is important that you mark the label «grafana_dashboard» with value 1, and that the namespace is the one that Grafana Operator has configured. In the case of Rancher, this namespace is «cattle-dashboards».
Header image: Campaign Creators at Unsplash