Flow Engine Monitoring
In this release 5.0.0-Renegade, we have included a new functionality for monitoring Flow Engine resources.
To ease the monitoring of resource consumption by each Flow Engine domain (NodeRED instance), we have created a number of Platform elements that will allow you to analyze the logs of said module and view the consumption information of resources and execution of processes in a simple way through a Dashboard.
How does it work?
In order to interpret these logs, to filter the relevant information and to translate it into a Dashboard, the following is required:
Entities and Digital Client
Two Entities have been created, as described below:
- flowEngineResourceConsumption: for resource usage per domain. Said entity will store the consumption of CPU, RAM memory, number of open connections and their status (active or not), as well as the timestamp. These logs are generated every half minute.
- flowEngineDomainLogs: to store the rest of the log traces by domain, having as its fields:
- timestamp/timestampISO: millis and text interpretation in ISO 8601 of the moment the record was generated.
- level/leve_name: level of trace and interpretation to text (INFO, WARN, ERROR, etc.)
- domain: Flow Engine domain (nodeRED instance).
- id: identifier of the node that generates the trace.
- type: type of node (nodeRED type name) that generates the trace.
- msg: object with the content of the message. In most cases, this object will contain the message ID.
- z: flow identifier (nodeRED tab) where the trace is generated.
These Entities will be available for exploitation. A Digital Client has also been created to access these entities, named as: «FlowEngine-logging-client».
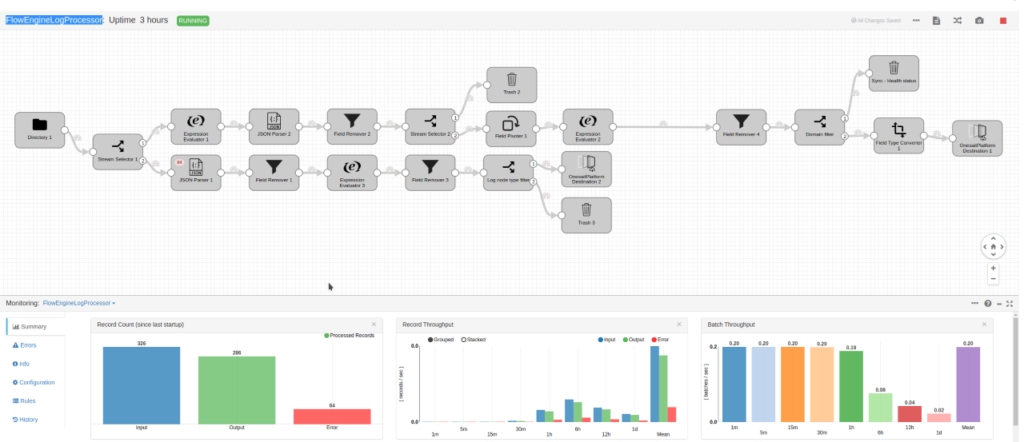
DataFlow
A DataFlow has been created to read the logs, process them and load the previous Entities. It is called «FlowEngineLogProcessor».
Dashboard
To attack this data, we have also created a series of Datasources, Gadgets and a Dashboard. The list of items is as follows:
- Datasources: FlowEngineDomains, FlowEngineMonitor_cpu_usage, FlowEngineMonitor_logs, FlowEngineMonitor_ram_usage, FlowEngineMonitor_sockets_count
- Gadgets: FlowEngineMonitor_gadget_cpu_usage, FlowEngineMonitor_gadget_Domain_Logs, FlowEngineMonitor_gadget_memory_usage, FlowEngineMonitor_gadget_socket_count
- Dashboard: Dashboard Flow Engine Monitoring
In that Dashboard, we have two tabs:
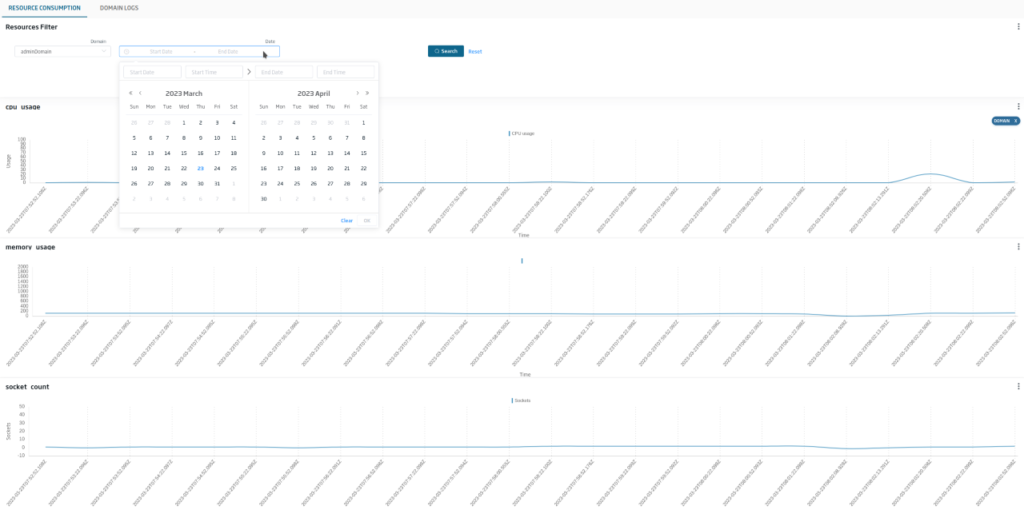
Resource consumption
To view consumption by domain, filtering by domain name and time range.
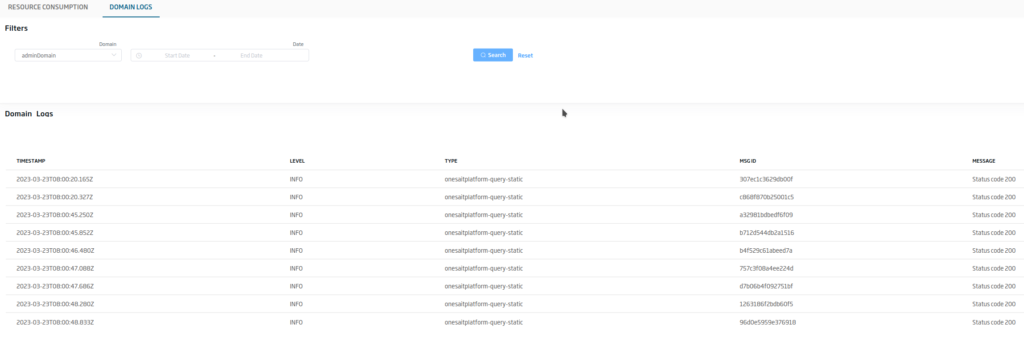
Domain Logs
To view domain logs directly, allowing the same filtering by domain and date/time range.
How to deploy it?
So that you do not have to create all these elements manually, we have addedmodule an automatic generation process for them to the configInit.
By default it will be enabled, but you created these by launching the module with the «onesaitplatform.init.flowEngineMonitor» property, or with the «LOADFLOWENGINEMONITOR» environment variable set to true.
The only thing necessary for DataFlow to access the logs is to map a volume to the Streamsets/Dataflow module, pointing the local directory «/var/log/platform-logs» to the volume where the Flow Engine is generating the logs.
Header image: Carlos Muza at Unsplash.