
Development of a new map viewer library
More and more, our Products and Projects require being able to represent data with a spatial component and even, in some cases, to perform calculations based on said data to obtain new layers of information.
Until now, each development team was in charge of creating a specific map viewer for their needs. This way of working was not very efficient because, although in general all the viewers had the same functionalities (view controls, selections, geocoding, etc.), each one of them was developed from scratch by different people, and it was quite difficult to share functionality between different teams.
To address this situation, throughout this Q4 of 2022 we have been developing a library of map viewers with GIS capabilities aimed at its use in all Products and Projects that require geospatial data representation. For its design, we have based ourselves on all the work of gathering the needs of the different Products and Projects where there are map viewers that we carried out during Q3, analyzing and classifying the functionalities used.
We have just published the first stable version of the library, so during the next Q1 of 2023 we will dedicate ourselves to implementing it on the Platform, so as to be able to configure the viewers quickly and easily.
Used technologies
At the source code level, we have developed the library with TypeScript, a superset of JavaScript that mainly adds static types and class-based objects. The API has been completely abstracted from the map library being used, so it is independent of the provider used. It can be also used with any current framework on the market (Vue, Angular, etc.).
Regarding the map library used, for this first version, we use OpenLayers version 6.14.1. As previously mentioned, the library is designed in such a way that it allows the updating of OpenLayers versions, as well as to contemplate the use of other different libraries (CesiumJS, Leatlet, etc.) in the future.

Work approach
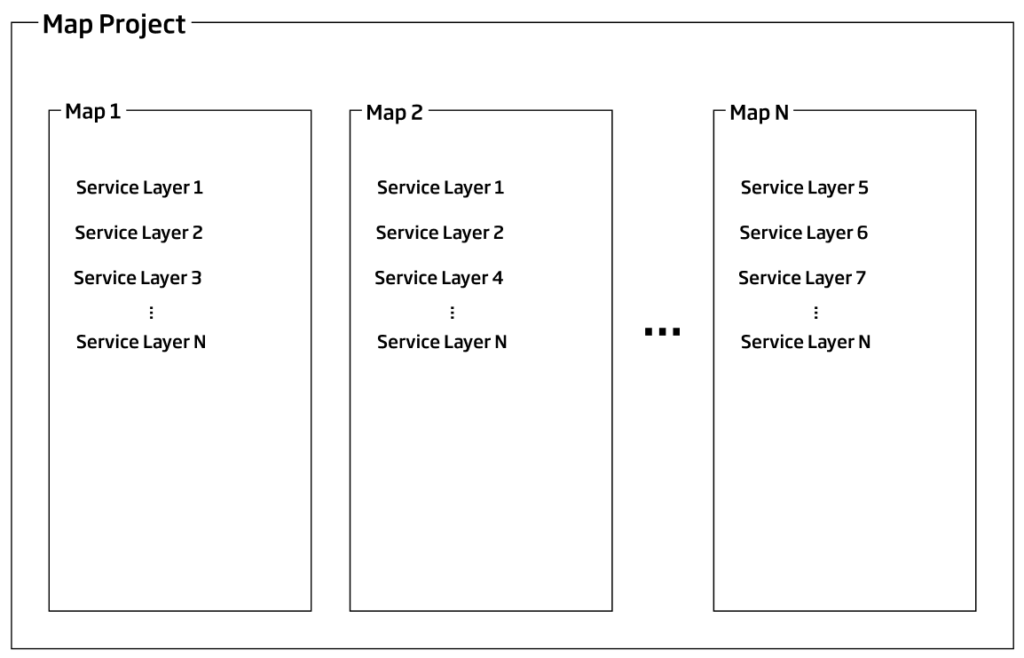
When working with the library, at a hierarchical level we are going to differentiate three different levels:
- Layer service: corresponding to a geospatial data layer, such as a GeoJSON, a WMS service, etc.
- Map: it is the map viewer containing the layer services that are defined.
- Map project: this is the container that would contain the different maps that we want to use.
Therefore, we can say that every Project and Product that makes use of this library, will have one or more map projects, those will contain all the maps that are required, and each of them may have the layers that are deemed appropriate.
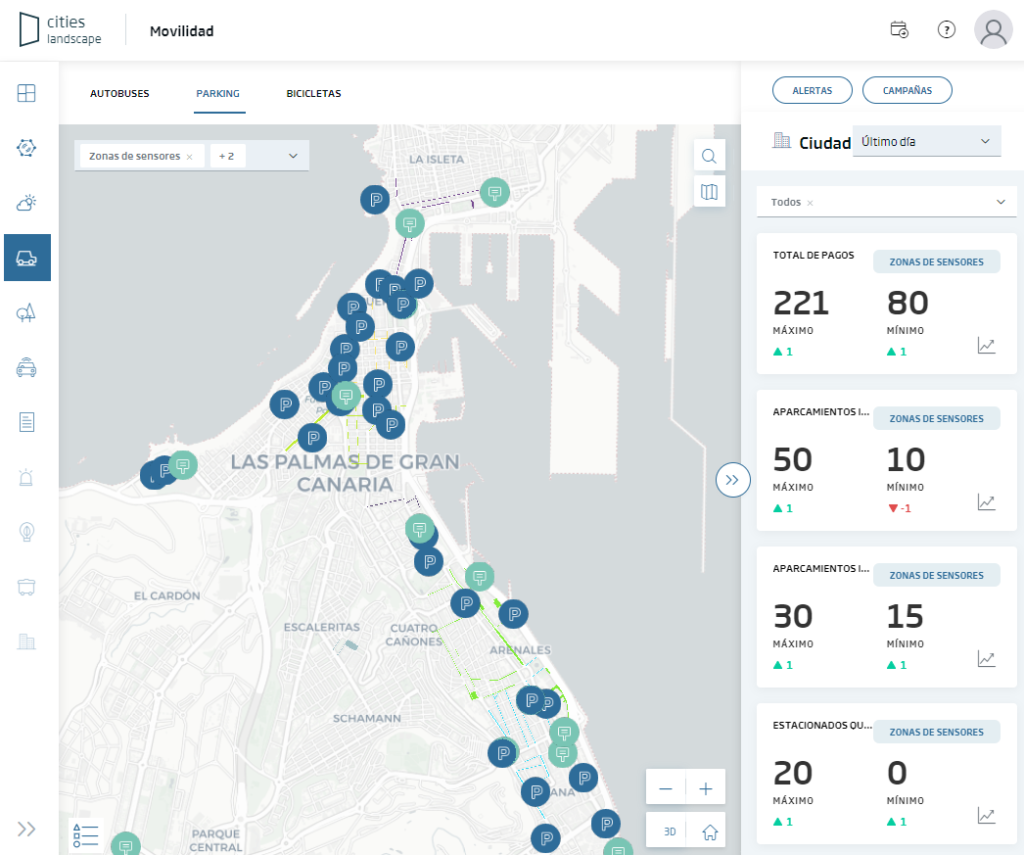
Thanks to this classification, it is possible to generate all kinds of map viewers, contemplating all possible cases: a single map, two maps to compare contents, a mesh with multiple maps, etc.
Map project settings
The creation of a map project, which contains the maps with their respective layer services, is based on a configuration file in JSON format that contains all the information necessary to configure the map project.
This JSON file includes, roughly, the following information:
- Identifier of the container that will contain the map project.
- Maximum number of maps allowed.
- Map display: mesh or stack.
- Map export properties: such as the logo to be used.
- Properties of the different tools: symbology styles, service providers, service properties, etc.
- Project maps: with the configuration of each of the maps, including:
- Library to use in the map: OpenLayers by default.
- Map name.
- Whether it is active or not.
- Whether it is initially visible or not.
- Its opacity.
- Initial view options: initial coordinates and zoom, projection system to be used, maximum and minimum zoom allowed, etc.
- Map interactions: double click zoom, map rotation, etc.
- Layer services: with the list of layers and their properties, such as:
- Layer name and identifier.
- Layer type.
- Initial opacity.
- Whether it is initially visible or not.
- Whether it is selectable or not.
- Whether it is editable or not.
- Data source: URL and original projection of the data.
- Symbology to be used.
Main features
In summary, the new API allows carrying out all the needs detected in all the Products and Projects analysed.
Some of the features we highlight here are:
- Support of several maps for the same viewer, with the option to synchronize the different maps with each other.
- Support of different vector formats: GeoJSON, GML.
- OGC content support: WMS, WMTS, and WFS services, according to the Inspire directive.
- Different data sources: feature layers from the Platform, and GIS server services (GeoServer, MapServer, ArcGIS Server, etc.) can be used.
- Vector edition: you can add geometries, modify or delete them.
- Direct navigation to a coordinate.
- Navigation tools: zoom control, scroll history on the map, etc.
- Identification tools: popup that shows the information of the selected entities, both vector and WMS services.
- Measurement tools: both linear and area in different formats: international and imperial system.
- Entity selection tools: both by attributes (selection of an entity by a field value) and by geometry (selection based on a geometry).
- Dynamic loading of services from the Front: of OGC services: WMS, WMTS and WFS.
- Integrated geocoder: both direct for address search and inverse to obtain coordinate information.
- Route manager: to calculate a route from definite way points, considering roadblocks. Includes options to optimize route, means of transport, etc.
- Map printing tools: with the possibility of printing the map of the view in PDF, PNG or JPG format, in different resolutions.
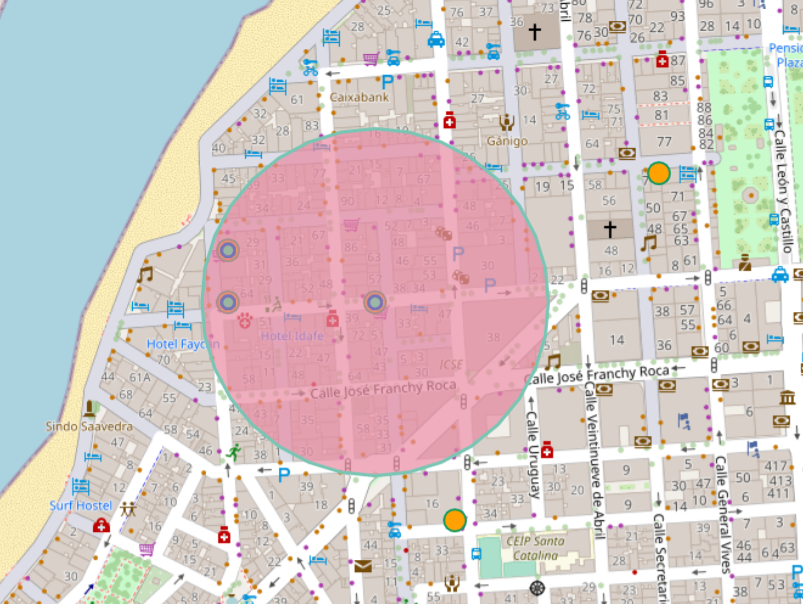
- Geoprocessing tools: including some basic GIS tools such as:
- Buffer: either from features in a layer, geoprocessing results, or interactions on the map, as well as from user-defined geometry.
- Intersections: between layers, results of geoprocessing, or interactions on the map, such as from user-defined geometry.
- Proximity analysis: between features in a layer, geoprocessing results, or interactions on the map, such as user-defined geometry.
Next steps
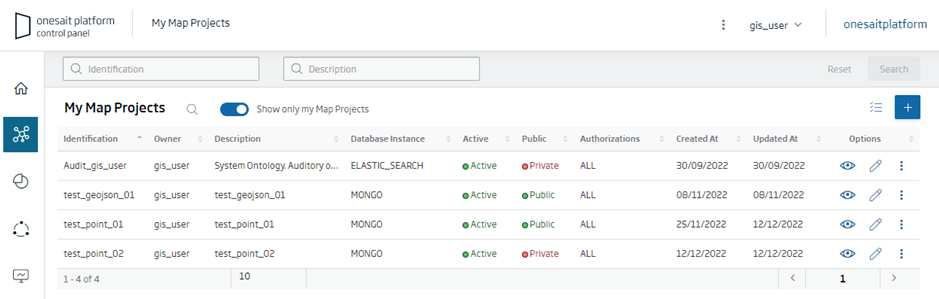
Throughout Q1 of 2023, we will proceed to develop the wizards for creating map projects, maps, and layer services that will allow us to intuitively and quickly generate the JSON configuration files, thus being able to create our viewers from the Platform itself.
Header image: Colton Sturgeon from Unsplash