JMeter good practices
Apache JMeter is an open source software designed and built in Java, that allows you to perform set of tests on a system. Initially, it was created to test web applications, but nowadays it is extended to virtually any type of application.
It is a project of the Apache Software Foundation and, as such, we recommend using its page and official documentation as a reference.
JMeter itself is a cross-platform desktop application with a graphical interface that allows you to configure test suites to be run on demand. In addition, it offers a CLI (Command Line Interface) tool, which, as we will see, will be very useful within the scope of this article.
This article explains a case study of real use of JMeter, to test a REST API served by Springboot artifacts running on Openshift Kubernetes Pods.
We will not stop to explain in a great detail the possibilities offered by JMeter as such, since it is very versatile and they are very extensive. We will briefly explain only what the chosen use case consists of and how to configure it. Below we will explain a possible problem that could adulterate the accuracy of JMeter results in Cloud environments. Lastly, we will provide a solution to this problem.
Used versions
- Infrastructure
- Apache JMeter 5.3
- Kubernetes 1.18.3
- Openshift 4.5
- Software (not relevant)
- Java 8
- Springboot 2.3.3
- Spring 5.2.9
Use case
This entry is based on the experience of a real project carried out during the last quarter of 2020. It is about the refactoring of a monolithic Javalegacy (Java <= 7) payment method system to a Cloud system with microservices with Java (>=8) and Springboot.
The core of the requirement was to study the response times of the application deployed with the new architecture under conditions similar to Production’s. To carry out this simulation, and to be able to obtain the response times, we used Apache JMeter 5.3 configuring an HTTP request module within a group of threads that defines the desired concurrency.
Test setup
As we had said before, we are not going to expand on the many possibilities that JMeter’s graphical client offers as such, although we will briefly detail below how we configured the test suite that we needed in our case study.
To boot it, execute the jmeter command after including it in the PATH and without any modifiers.
Tree interface
JMeter offers an intuitive interface. On the left side, the modules, configurations and reports that we need for our tests are added in the form of a tree. When selecting one node, the elements and parameters related to the selected node are configured on the right side.
The tests are executed by reading the modules from top to bottom, with the possibility of creating concurrent execution loops, defining counters, variables and other control elements, as we will see below.
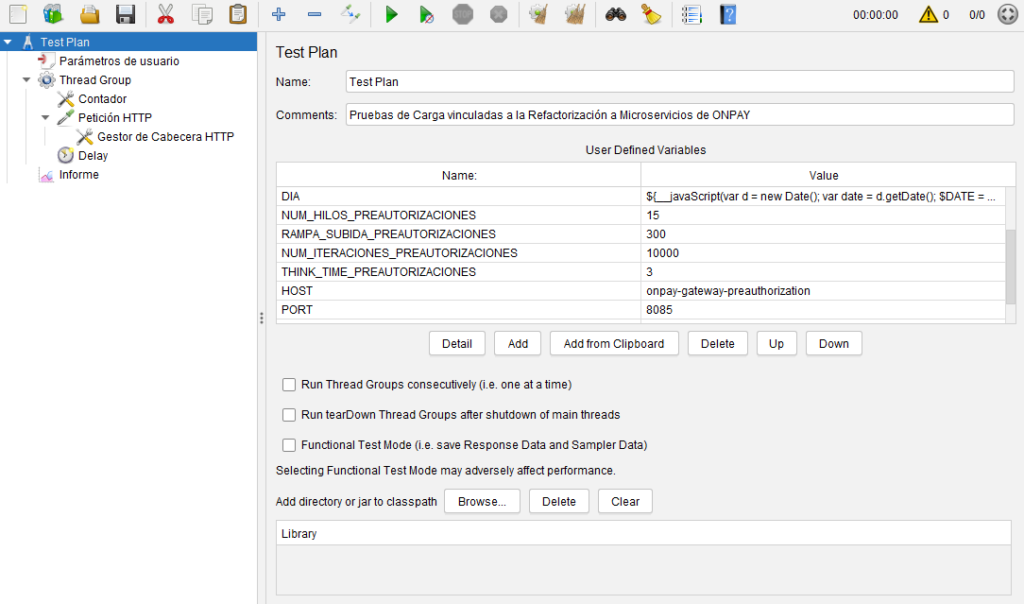
Root Node – Test Plan
All configurations and modules hang from this node. It allows defining global parameterization and test execution strategies. Bear in mind that the parameters can carry dynamic values by accepting JavaScript code (see variable “DIA”).
To refer to the variables defined in this module (or to other parameterization modules), the nomenclature of ${variable_name} is used.
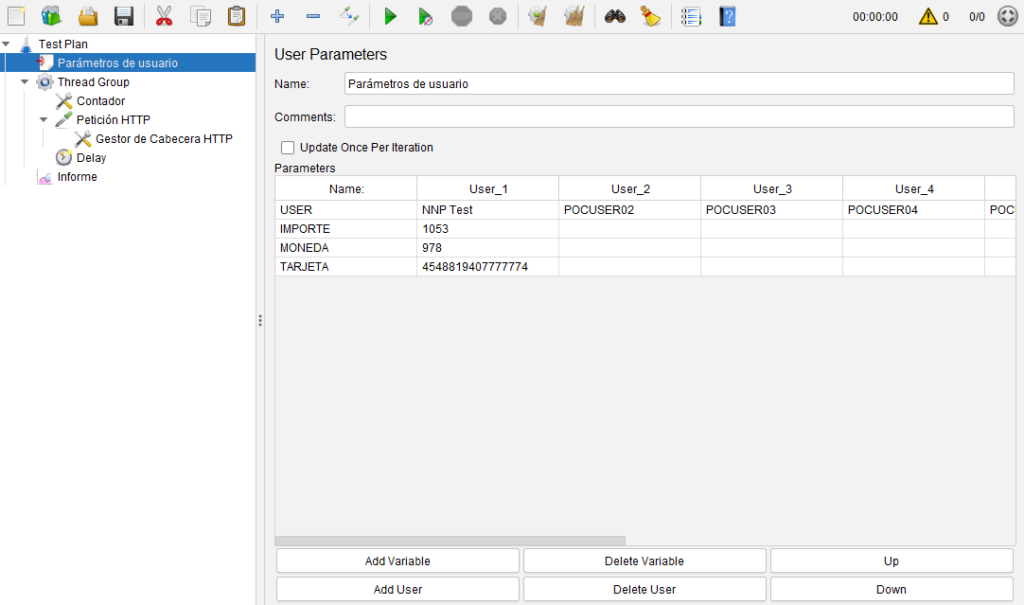
User parameters
This module allows the configuration of different users and parameters associated with them.
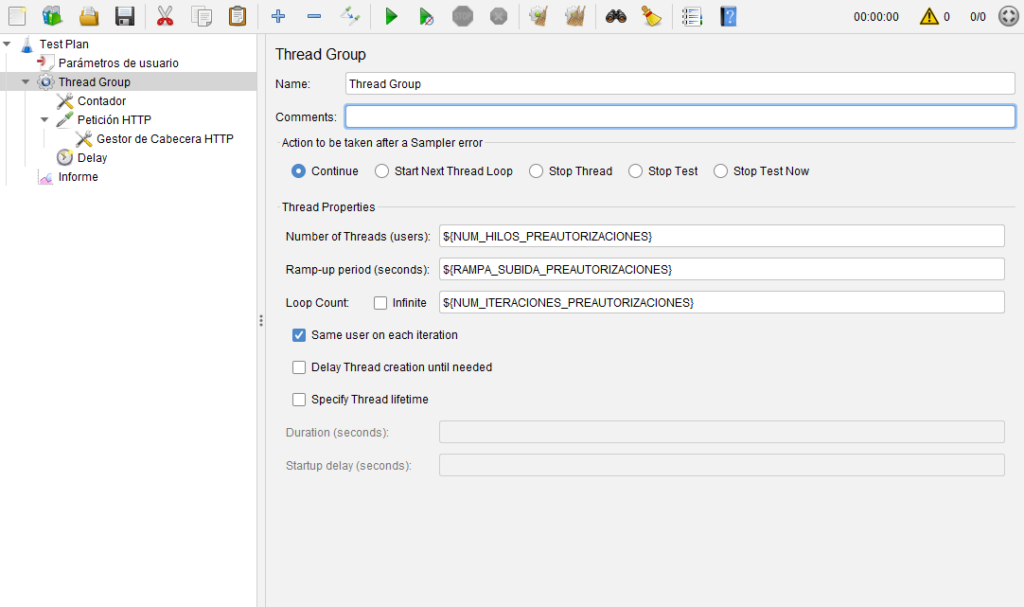
Thread Group
A Thread Group base node is configured for each concurrency group to be launched. The modules that are hierarchically under this group will be executed concurrently, and from top to bottom. In our test, there is only one thread pool. To define concurrency and thread group behavior, the following parameters must be defined:
- Number of threads: simulates the concurrent users that will be carrying out the tests defined in the group.
- Ramp up period: Defines a number of seconds to reach the full performance of the test, generating an arithmetic growth from 0 to N threads in those seconds.
For example, if the number of threads defined is 50 and a ramp-up of 300 seconds (5 minutes) is defined, JMeter will start threads at a rate of 10 new threads per minute for those first 5 minutes. - Loop count: number of times the tests defined in the group will be executed for each configured thread.
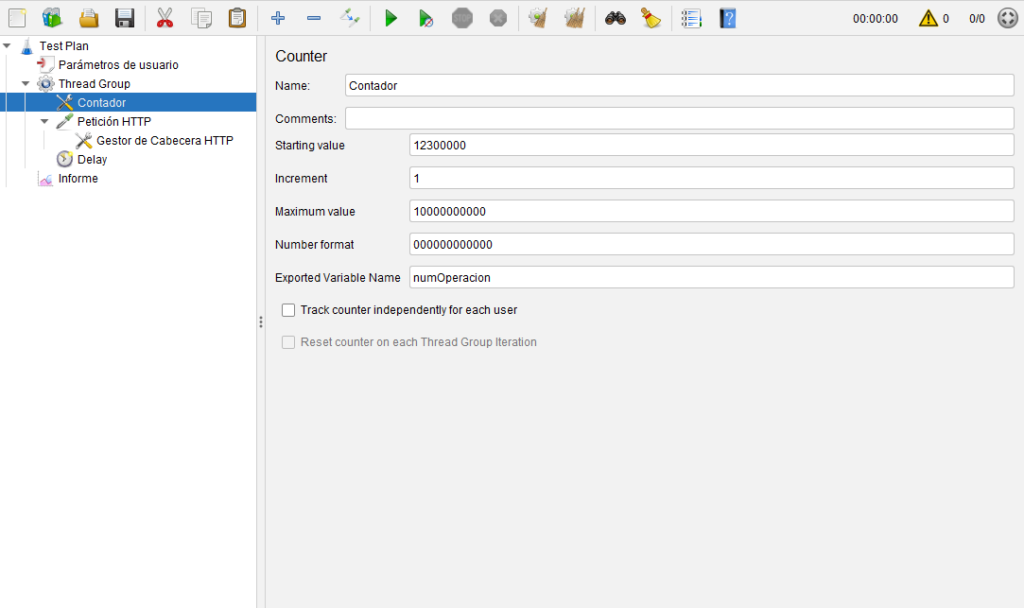
Counter
It allows to generate a different value for each one of the tests that are going to be executed. This is very useful to differentiate each test and thus allow specific traceability. When a thread finishes an execution, and if it has not reached the number of tests defined in Loop Count, it will restart the Thread Group’s loop passing through this counter to increment it by one, as seen in the following image.
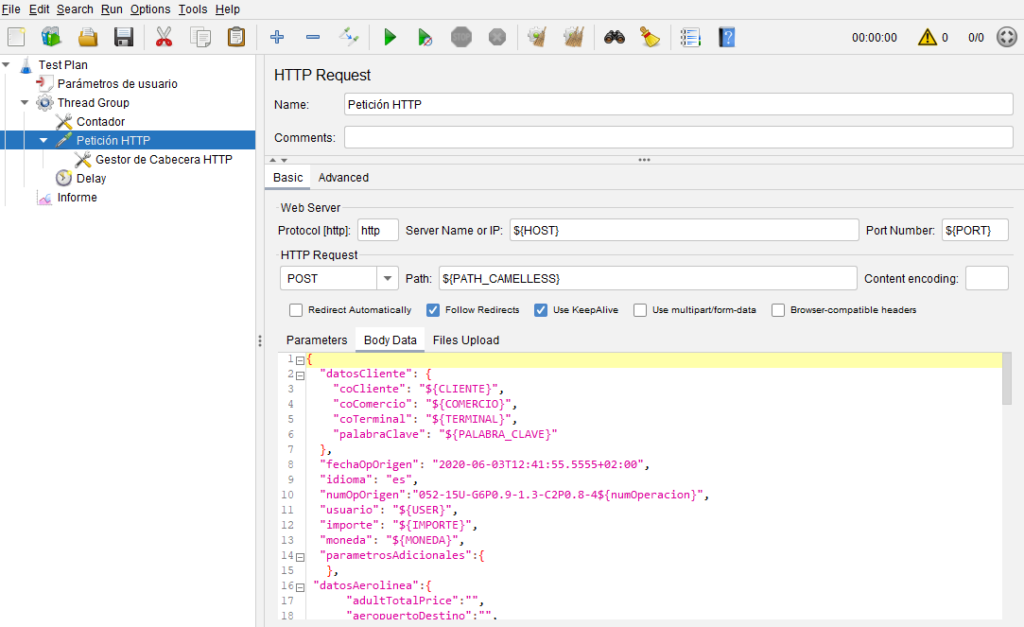
HTTP Request
This module represents the most important module in our tests, as it defines the HTTP request to our OpenShift-hosted Springboot microservices system.
As you can see in the image, this module, together with its child «Gestor de Cabecera HTTP» («HTTP Header Manager»), has everything you need to build an HTTP request.
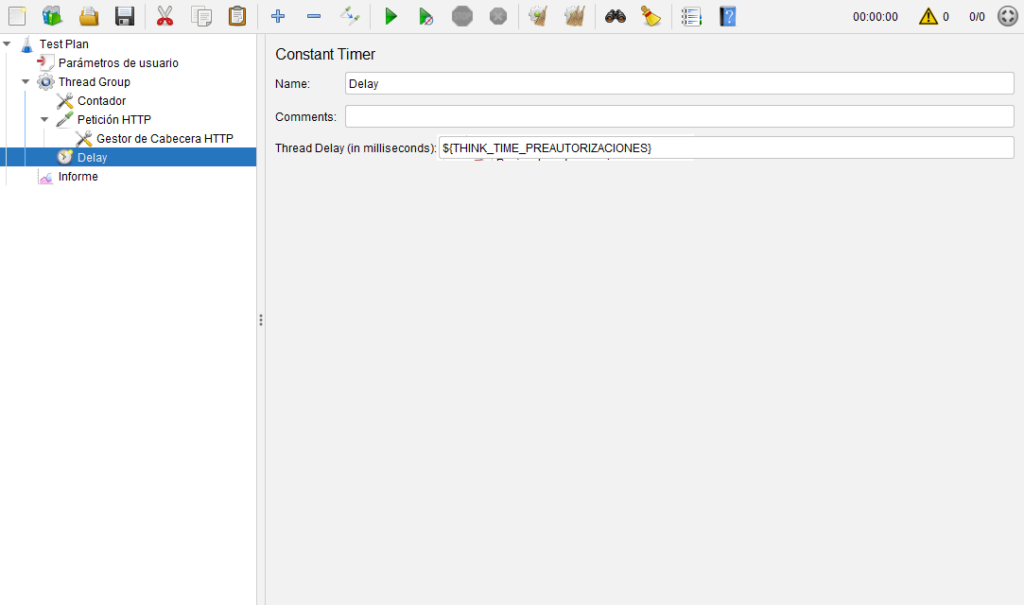
Delay
The last element included in the concurrency loop is a delay in milliseconds, before moving on to the next iteration.
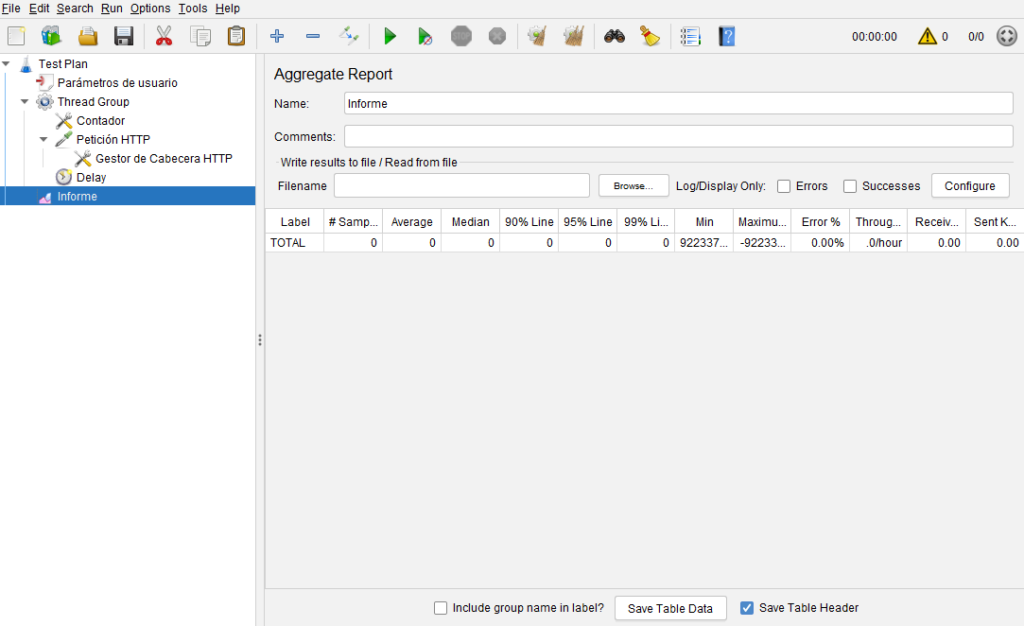
Reports
JMeter has a rich set of modules for generating reports. In our project, we have not used them, since the measurements have been made through the writing of logs using the EFG stack. But, we show an image of what an aggregate report output module would look like.
Test run
From the graphical interface
From the client itself, the play buttons are shown, and they have modifiers to pause it, resume it, restart it, etc. This is intuitive and does not deserve a detailed explanation.
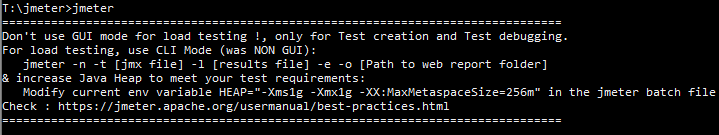
Bear in mind that the tool itself warns you, by means of a message at the beginning, that the use of the graphical version for load tests is not recommended, recommending its use only for the creation of tests and for the initial tests, to check their suitability.
From command line (CLI)
JMeter offers the possibility to work through its CLI tool, which is necessary when it comes to run load or performance tests. Besides, the command version gives you the possibility of accessing the shell of a cloud-based container that has the tool installed, then working with it by taking advantage of the networking that the Cloud platform offers us. This way, we prevent possible network latencies from adulterating the results that the tool itself measures and offers.
In the next point of this article, we will describe how to configure it and run tests in the Cloud using OpenShift. But first, we are going to focus on the command itself and the files related to JMeter.
Related Files:
- JMX: it is the xml where JMeter stores the configuration of a test – That is to say, the graphic tool, when configuring and saving the test, saves it in this format. Of course, it also allows you to load a test in the tool using this file.
- JTL: stores the accumulated result of the tests through a CSV strategy. The content of this file can be exported by JMeter to a readable format as a static web.
- Report Folder: JMeter also allows you to directly generate the folder with the static HTML content (the one mentioned in the previous point), without having to generate it through a previous JTL.
An example command would be:
jmeter -n -t test_suite.jmx -l resultado.jtl -o dashboard_directory- -n: tells it to run the non-graphical version.
- -t: specifies the JMX source to be executed.
- -l: specifies the output JTL.
- -o: specifies the name of the directory where we want the static HTML that will make up the web with the test results to be stored.
This section of the official Apache JMeter documentation describes all the command switches.
Cloud Configuration
A Cloud architecture gives us the opportunity to run JMeter in the same network environment where the microservices to be attacked are hosted. In our case, where we use Openshift, it is very convenient to use the service names when specifying the API host. This is possible by configuring a Pod with a container that mounts the bare minimum to be able to run JMeter. Specifically:
- An operating system. In our case the choice is alpine (latest version).
- Installation via openjdk8_jre apk.
- Download by curl and decompression and installation via tar of JMeter 5.3.
Dockerfile
This is the Dockerfile used for container creation:
FROM alpine:latest


ARG JMETER_VERSION="5.3"
ENV JMETER_HOME /opt/apache-jmeter-${JMETER_VERSION}
ENV	JMETER_BIN	${JMETER_HOME}/bin
ENV	JMETER_DOWNLOAD_URL https://archive.apache.org/dist/jmeter/binaries/apache-jmeter-${JMETER_VERSION}.tgz

ARG TZ="Europe/Amsterdam"
RUN    apk update \

&& apk upgrade \
&& apk add ca-certificates \
&& update-ca-certificates \
&& apk add --update openjdk8-jre tzdata curl unzip bash \
&& apk add --no-cache nss \
&& rm -rf /var/cache/apk/* \
&& mkdir -p /tmp/dependencies  \
&& curl -L --silent ${JMETER_DOWNLOAD_URL} >  /tmp/dependencies/apache-jmeter-${JMETER_VERSION}.tgz  \
&& mkdir -p /opt  \
&& tar -xzf /tmp/dependencies/apache-jmeter-${JMETER_VERSION}.tgz -C /opt  \
&& rm -rf /tmp/dependencies

# Set global PATH such that "jmeter" command is found
ENV PATH $PATH:$JMETER_BIN

# Entrypoint has same signature as "jmeter" command
COPY entrypoint.sh /

WORKDIR	${JMETER_HOME}

ENTRYPOINT ["/entrypoint.sh"]
Deployment Configuration
The yaml used to configure the Deployment in Kubernetes is the following:
apiVersion: apps/v1
kind: Deployment
metadata:
  name: jmeter
  namespace: onpay-dev
  labels:
    app: jmeter
spec:
  replicas: 1
  selector:
    matchLabels:
      app: jmeter
  template:
    metadata:
      creationTimestamp: null
      labels:
        app: jmeter
    spec:
      restartPolicy: Always
      imagePullSecrets:
        - name: solutionsregistry
      schedulerName: default-
      terminationGracePeriodSeconds: 30
      securityContext: {}
      containers:
        - name: jmeter
          image: 'solucionesregistry.azurecr.io/jmeter:dev'
          command:
            - /bin/sleep
          resources:
            limits:
              cpu: '2'
              memory: 1200Mi
            requests:
              cpu: 600m
              memory: 1Gi
          volumeMounts:
            - name: jmeter-aux-files
              mountPath: /opt/apache-jmeter-5.3/aux
          terminationMessagePath: /dev/termination-log
          terminationMessagePolicy: File
          imagePullPolicy: Always
      hostAliases:
        - ip: 10.3.32.11
          hostnames:
            - >-
              onpay-gateway-rest-preauthorization-onpay-dev.apps.soluciones-cluster-dev.b2bconnect.es
      volumes:
        - name: jmeter-aux-files
          persistentVolumeClaim:
            claimName: jmeter-pvc
      dnsPolicy: ClusterFirst
  strategy:
    type: RollingUpdate
    rollingUpdate:
      maxUnavailable: 25%
      maxSurge: 25%
  revisionHistoryLimit: 10
  progressDeadlineSeconds: 600
Notoce that we use an image in the Registry called jmeter:
image: 'solucionesregistry.azurecr.io/jmeter:dev'We can also see that it must be associated with a PVC so that the file writes persist:
volumeMounts:

  - name: jmeter-aux-files

  mountPath: /opt/apache-jmeter-5.3/aux
Container Operation
As we have said, this is a container that does not have an active service, such as a Springboot, listening for requests. It is a simple operating system with JMeter installed that, after booting, we simply don’t need it to do anything but «exist» to be able to connect to it by command line.
For this reason, the «ENTRYPOINT» specified in the Dockerfile is irrelevant, and it’s the yaml’s command parameter the most important:
command:

  - /bin/sleep
What we are specifying is that it must do an infinite sleep, so that it simply does nothing. But, at the same time, the container execution remains alive and available to connect to the remote shell (rsh) via the Openshift CLI (OC).
That is to say, once the Kubernetes Pod has started, we can now execute the following to enter its shell:
oc rsh <nombre_pod> 
Running a test
As explained above, the command to run is jmeter -n (no GUI), passing it -t test_suite.jmx y -l resultado.jtl
Since we are in the Cloud, it is not useful to add the -o folder to generate the dashboard with the results, because it would be stored in the container filesystem and its result would not be directly accessible.
Instead, the mechanism used to execute remotely and collect the results locally is as follows:
- Copy the source jmx: use the oc cp (copy) command to have it available in the container.
oc cp suite_test.jmx pod_name:/opt/apache-jmeter-5.3/suite_test.xml
- Run the jMeter command and wait for the end of execution:
jmeter -n -t suite_test.jmx -l result.jtl
- Copy the result jtl from container to local:
oc pod_name:/opt/apache-jmeter-5.3/result.jtl result.jtl
- From the local copy of result.jtl, using JMeter, generate the static HTML folder with the result Dashboard:
jmeter -g result.jtl -o output_folder
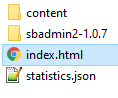
A set of static HTML files and directories with the following structure is generated in the output directory:
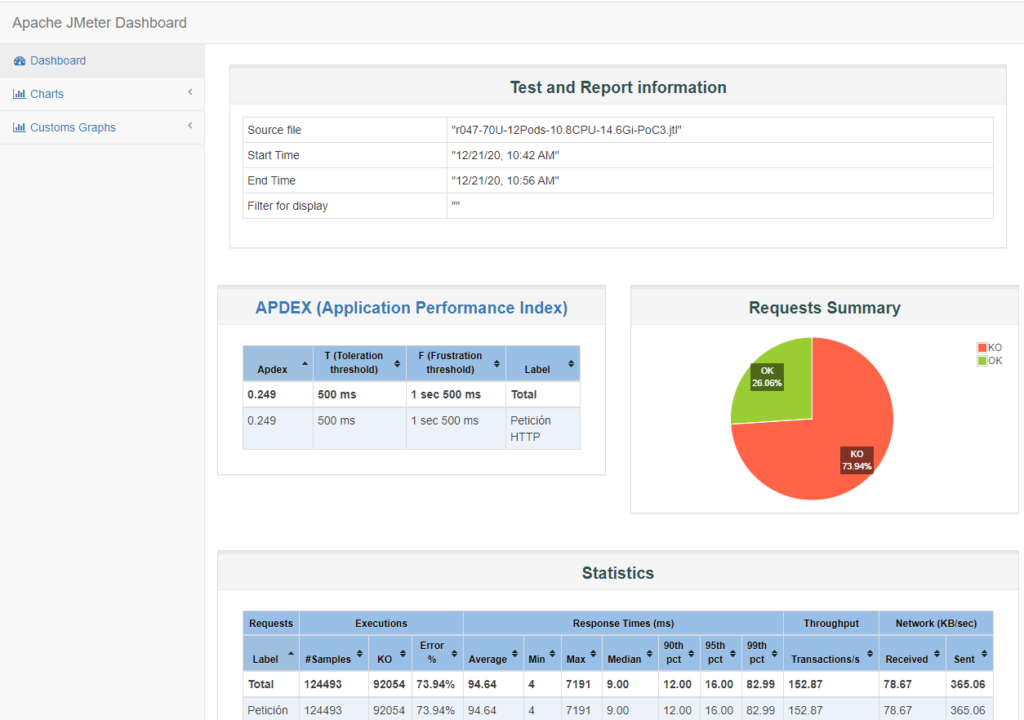
The generated dashboard allows you to graphically view averages, percentiles, transactions per second, error responses and other very useful statistics.
Conclusion
In this article we have reviewed the Apache JMeter Software utility for configuring and running performance tests. Furthermore, we have explained the strategy used to load JMeter into an Openshift Pod, run it from the cloud, and extract the results dashboard with JMeter’s own software.