
Map viewers (Part II): CesiumJS
Last week we started talking about the main web map viewer libraries. Today we are going to focus on the first of these libraries, CesiumJS.
As we said, this is an Open Source library, under Apache license, designed to create 2D, 2.5D and 3D maps at a global level, with good performance, accuracy, visual quality and ease of use.
Using the library
To use this library, we have three possible options:
- Download and install it.
- Use the Sandcastle environment.
- Consume it via URL.
Download and install
At the time of writing this post, the available version of Cesium is 1.77, which you can download from this link. Regardless of the version, the operation will always be the same, so don’t worry about that.
In order to use it, you have to set up a web server at the location of the folder (or upload the folder to your own web server, of course). For this, the common choice is Node.js, which you can download and set up on your local device, or if you use Visual Studio, you can make use of the Live Server extension, which incorporates the former and allows you to simulate the web environment (this is how I usually work).
Sandcastle environment
On the Cesium website there is a code editor called Sandcastle, with a lot of examples. It allows you to practice and play with the different available options. The best thing about it is that you don’t have to worry about libraries, configurations or anything else.
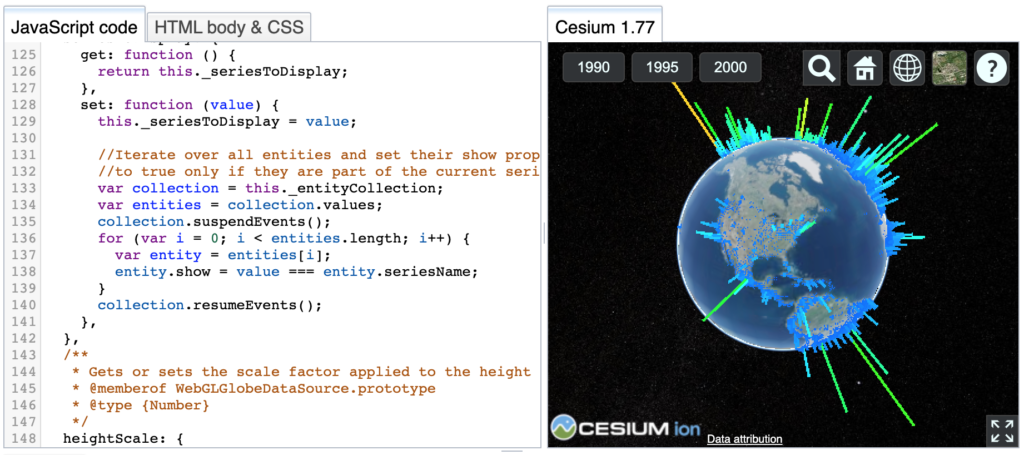
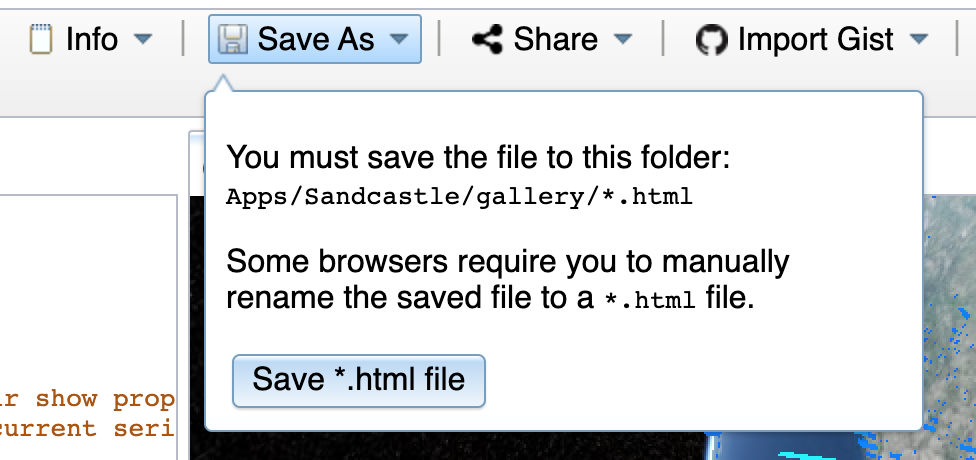
This is designed to put the described examples into practice, changing only the options and input parameters, but it is always possible to generate a complete viewer from scratch and then export the code and use it somewhere else, similar to Onesait Platform’s GIS viewers.
Another very interesting option is to generate a link that allows you to share the generated viewer and its code with other people.
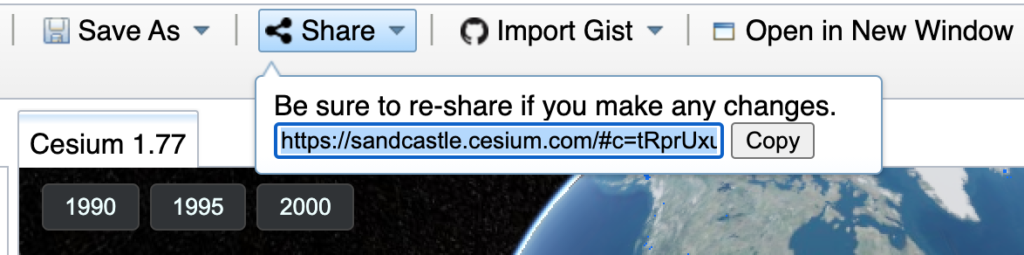
This is very useful if you need to prototype something to show quickly, without having to set up the development environment.
I’d like to point out that it is mandatory to use punctuation at the end of each code statement. If you come from Java or similar, this is no problem, but if you come from Python, well…
Consume the library via URL
Finally, we have the option to generate our web viewer consuming the library via URL, as if it were any other library hosted on a server.
This option is very practical for your developments, either using the URLs of the Cesium page, via NPM or from that local folder that you have somewhere.
Work environment
To carry out this tutorial, you are going to use Onesait Platform as a web environment. Specifically, you are going to make use of the CloudLab, the free experimentation environment in which you can test all of the the Platform’s capabilities without any limitation.
The idea, therefore, will be to generate a Dashboard with a Gadget. This gadget will contain the map and it’s here where you will be able to experiment in a quick and easy way.
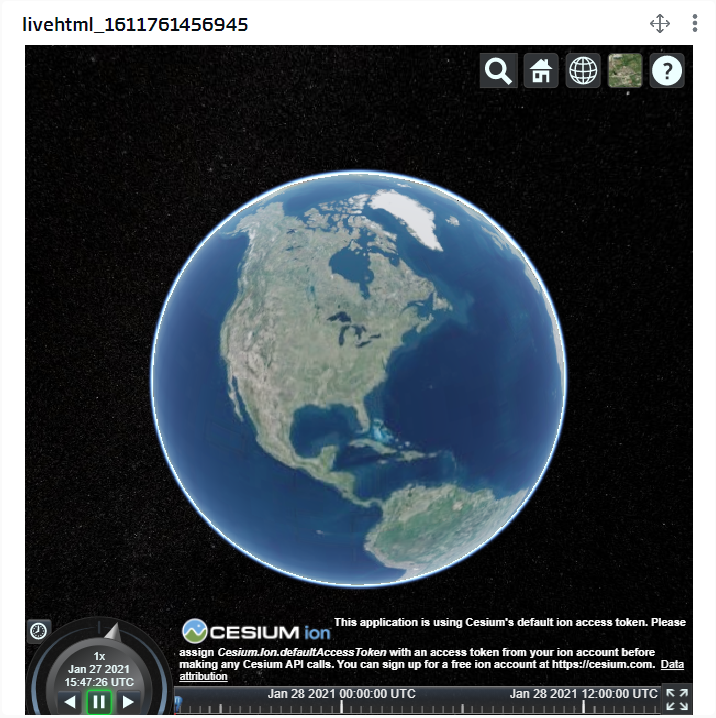
When you finish, you will have something like this:
Why is it blinking? We’ll see that later.
If you already know how to set up the Dashboard, load the libraries and generate the Gadget, you can skip this section and continue to «Generate the Cesium map».
Loading the libraries
To simplify things, you are going to use the libraries available from the Cesium server, so you don’t need to install or mount anything.
Specifically, you need two libraries: one with the JavaScript functionalities and the other one with the design styles:
https://cesium.com/downloads/cesiumjs/releases/1.77/Build/Cesium/Cesium.js
https://cesium.com/downloads/cesiumjs/releases/1.77/Build/Cesium/Widgets/widgets.cssNote: it is important to always load the JS library above the CSS library, to avoid weird errors.
With these URLs copied to the clipboard, continue.
Dashboard generation
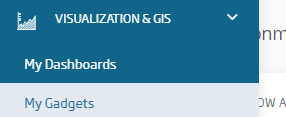
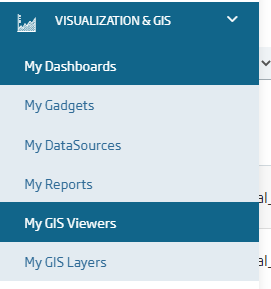
Once in the Platform, navigate to the Visualization & GIS > My Dashboards menu.
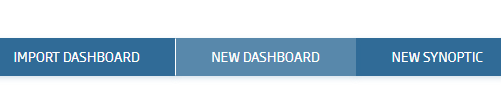
In the window that appears, click on the «New Dashboard» button on the top right to create a new Dashboard.
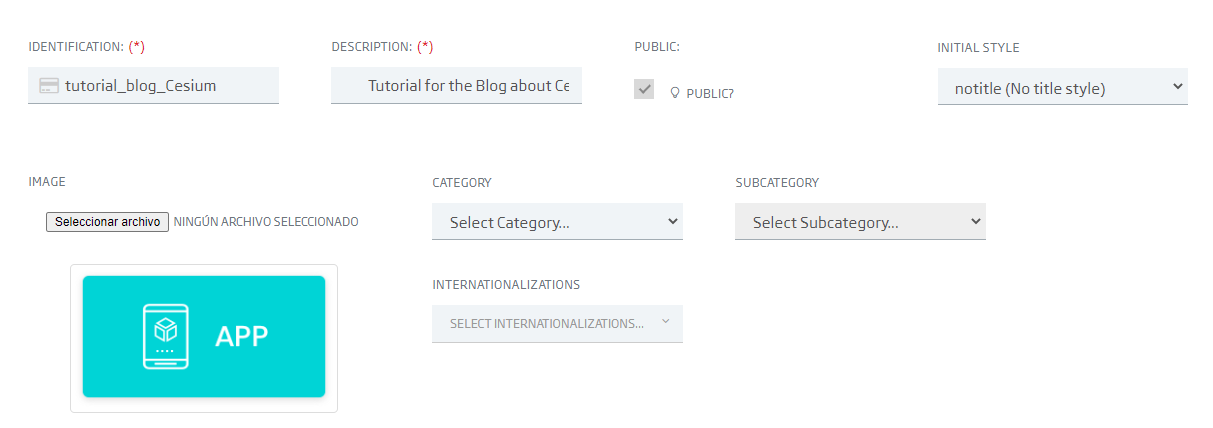
Here you have to fill in the options that the creation wizard requests:
- Identification: give it a characteristic name; in this case I have named it «tutorial_blog_Cesium».
- Description: indicate a text that describes your Dashboard.
- Public: check you we want the Dashboard to be freely accessible
- Other options: you can leave them with the default options; they do not affect this tutorial.
Next comes the important part: including the Cesium libraries. You will do this in the lower screen, where it says «Global Styles, Libraries and Scripts».
As if it were the content of the of an HTML, you will include it like this:
  <script src="https://cesium.com/downloads/cesiumjs/releases/1.77/Build/Cesium/Cesium.js"></script>

  <link href="https://cesium.com/downloads/cesiumjs/releases/1.77/Build/Cesium/Widgets/widgets.css" rel="stylesheet">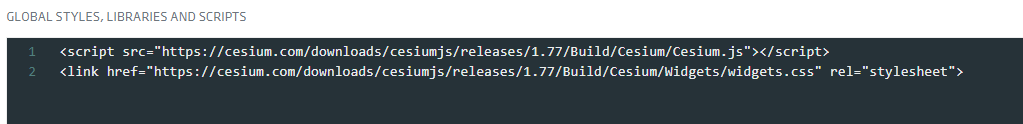
Once this is done, you will only have to click on the «New» button, and you will have the Dashboard ready to work with.
Gadget Preparation
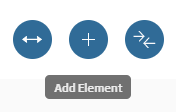
You already have the Dashboard ready, but it is empty, so you’ll have to generate a Gadget that will contain the map. To do this, click on the «+» button at the top right.
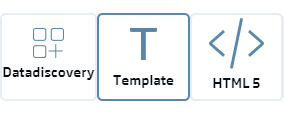
A carousel with different types of Gadgets will appear at the bottom of the screen. In this case, choose the one called «Template», and drag it to the bottom of the Dashboard.
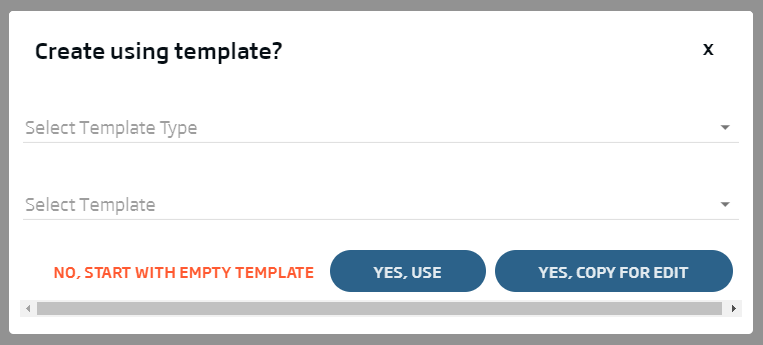
Once this is done, you will see a window asking for the type of template and whether you want to use a pre-existing template or not. Ignore all this, and start by creating an empty template.
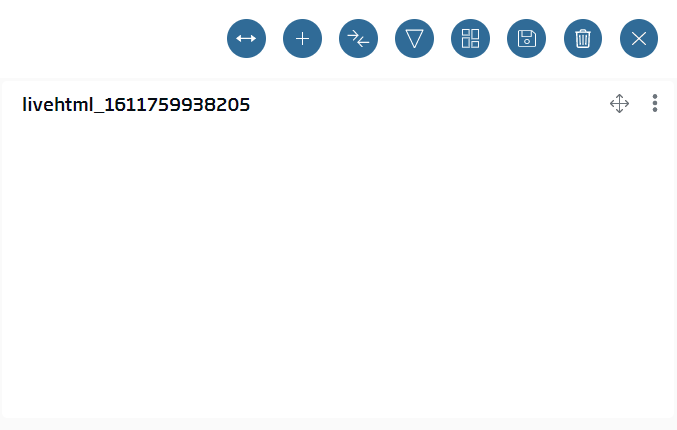
Now you have our Gadget ready to prepare it and build the map.
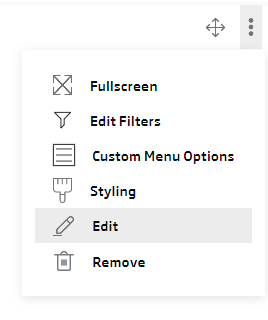
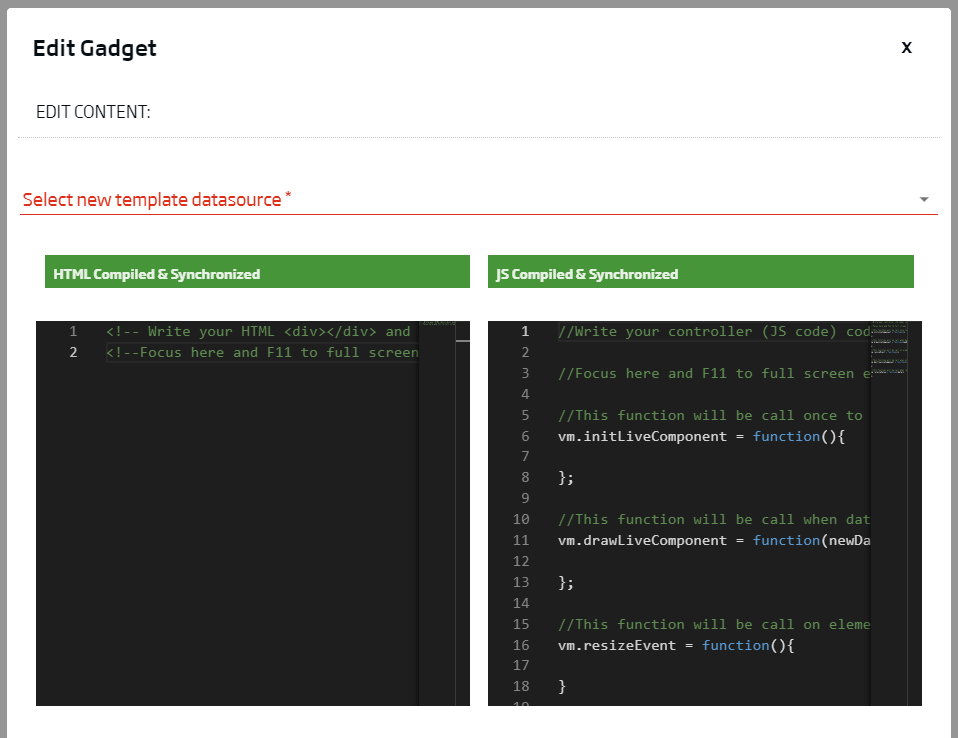
To configure the Gadget, access the menu by clicking on the three dots at the top right. Among the different options we find, select «Edit».
This will open a window with two sub-windows: The one on the left allows you to enter the HTML and styles of the map, and the one on the right allows you to enter the logics of the map, using JavaScript.
Generating the Cesium map
Well, after all this yarn this long explanation, let’s get to the interesting part: We’re going to prepare the map.
The first thing to do is to define an HTML container that will contain the map. To do this, in the window on the left, include the following line of code:
<div id="cesiumContainer"></div>Easy, isn’t it? Let’s give the theme a bit of styling, you willll create a style tag (on top of that), and add height: 100% and an automatic width, so that the map fills the entire Gadget.
<style>
   #cesiumContainer {
      width: auto;
      height: 100%;
   }
</style>

<div id="cesiumContainer"></div>
With this, you will already have the HTML part configured. Next, you are going to program the logical part in JavaScript. Therefore, in the window on the right, locate the «vm.initLiveComponent» function, and inside it define a variable called «viewer» as I show you next:
//This function will be call once to init components
vm.initLiveComponent = function() {

   let viewer = new Cesium.Viewer('cesiumContainer');
};
And that’s it. Click on the «Compile & Synchronize» button and see what happens.

That’s it: Habemus chartam geographicam:
As you can see, creating a map viewer isn’t difficult at all. The only detail you have to keep in mind is the input parameter you put to the «new Cesium.Viewer()» function.
If you look carefully, you will see that the string you entered, «cesiumContainer», matches the name of the class of the container created in the HTML window. This means that, in the function, you are specifying the DIV where you will create the viewer, so if you change the name of the DIV for whatever reason, remember to change it in the input parameter as well.
Possible map viewer configurations
The «new Cesium.Viewer()» function optionally accepts a second parameter: an object with the viewer’s configuration options.
There are a lot of possible options, as we can see in the Cesium documentation:
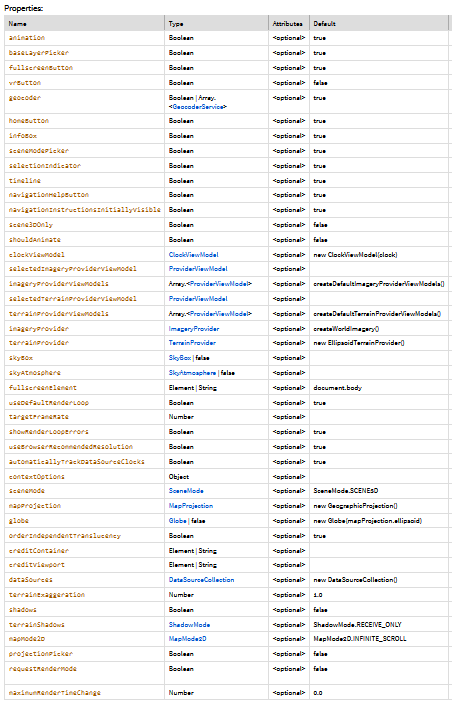
As the idea of this post is to be a small introduction, I will comment only some of the most interesting/requested ones:
- Change the viewer to 2D, 2.5D or 3D: if you want the map to appear in one of those dimensions by default, you will have to configure the «sceneMode» property according to:
- 2D: sceneMode: Cesium.SceneMode.SCENE2D
- 2.5D: sceneMode: Cesium.SceneMode.COLUMBUS_VIEW
- 3D: sceneMode: Cesium.SceneMode.SCENE3D
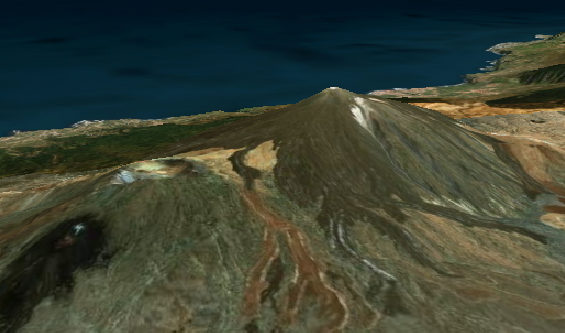
- 3D terrain: if you want the terrain not to be a perfect plane but to show elevations, you will have to indicate: terrainProvider: Cesium.createWorldTerrain()
Something that is also in great demand is to «clean» the viewer, because as you can see there are a lot of elements that may not be useful for anything (base map selector, geocoder, timeline, etc.).
To do this, you only need to add the following options:
- Hide basemap selector: baseLayerPicker: false
- Hide geocoder: geocoder: false
- Hide the Home button: homeButton: false
- Hide the infoBox (the popup that appears when you click on an entity): infoBox: false
- Hide timeline: timeline: false
- Hide clock: animation: false
- Hide 2D/2.5D/3D mode picker: sceneModePicker: false
- Hide navigation help: navigationHelpButton: false
All these options, when represented at code level, would look like this:
vm.initLiveComponent = function(){
let viewer = new Cesium.Viewer('cesiumContainer', {
sceneMode: Cesium.SceneMode.COLUMBUS_VIEW,
terrainProvider: Cesium.createWorldTerrain(),
baseLayerPicker: false,
geocoder: false,
homeButton: false,
infoBox: false,
timeline: false,
animation: false,
sceneModePicker: false,
navigationHelpButton: false
});
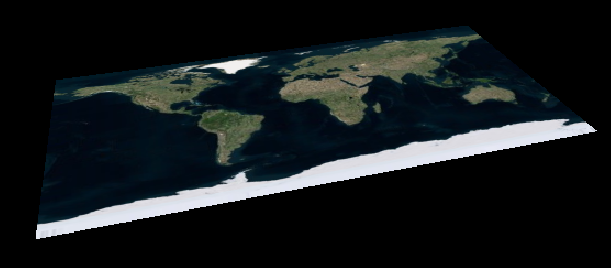
};If you apply these options, the map viewer will look like this:
Fairly better, isn’t it?
The Cesium Ion (the geospatial data platform) logoand the default token note cannot be removed using these map viewer options.
As you may have seen, there are many other options available to configure, so if you’re interested, take a look at what’s available and give it a try, to see what happens.
Load a layer
I apologize if we have taken so long to get to the main thing, which is loading layers, but I think it was important to know a little about how to configure our viewer before adding content to it.
Cesium, like the other viewers we are looking at, makes use, among other formats, of GeoJSON, which is a JSON file with data referring to spatial location.
For this tutorial, I have created a simple GeoJSON with a few points that you can use as an example:
{
  "type": "FeatureCollection",
  "features": [
    {
      "type": "Feature",
      "properties": {
        "id": "Work"
      },
      "geometry": {
        "type": "Point",
        "coordinates": [
          -3.641436696052551,
          40.529066557739924
        ]
      }
    },
    {
      "type": "Feature",
      "properties": {
        "id": "Lunch"
      },
      "geometry": {
        "type": "Point",
        "coordinates": [
          -3.6394304037094116,
          40.53058739857294
        ]
      }
    },
    {
      "type": "Feature",
      "properties": {
        "id": "Beer"
      },
      "geometry": {
        "type": "Point",
        "coordinates": [
          -3.639392852783203,
          40.530179669832364
        ]
      }
    }
  ]
}
Although we usually have this type of file hosted elsewhere and consume them via API or similar, here we are going to embed it in our code, defining it as a variable after declaring the «viewer» with its options:
vm.initLiveComponent = function(){
   let viewer = new Cesium.Viewer('cesiumContainer', {
      sceneMode: Cesium.SceneMode.COLUMBUS_VIEW,
      terrainProvider: Cesium.createWorldTerrain(),
      baseLayerPicker: false,
      geocoder: false,
      homeButton: false,
      infoBox: false,
      timeline: false,
      animation: false,
      sceneModePicker: false,
      navigationHelpButton: false
   });

   const myJSON = {... here will come the JSON ...}
};
Ok, it’s time for the magic; using the «Cesium.GeoJsonDataSource.load()» function, we are going to load that JSON in the map viewer as a layer. What we have to write is:
vm.initLiveComponent = function(){
let viewer = new Cesium.Viewer('cesiumContainer', {
sceneMode: Cesium.SceneMode.COLUMBUS_VIEW,
terrainProvider: Cesium.createWorldTerrain(),
baseLayerPicker: false,
geocoder: false,
homeButton: false,
infoBox: false,
timeline: false,
animation: false,
sceneModePicker: false,
navigationHelpButton: false
});
const myJSON = {... aquí vendría el GeoJSON ...}
viewer.dataSources.add(Cesium.GeoJsonDataSource.load(myJSON));
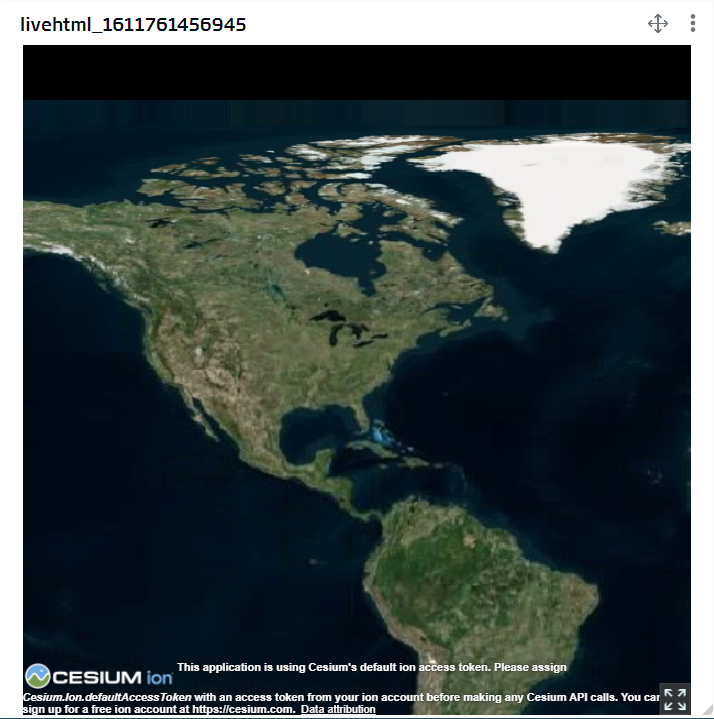
};If we synchronize and compile the Gadget again, we’ll have our first layer loaded:
But… Isn’t this a bit too ugly? The map is centred in North America, with a world view, but my data are at a local level… Well, everything has a solution.
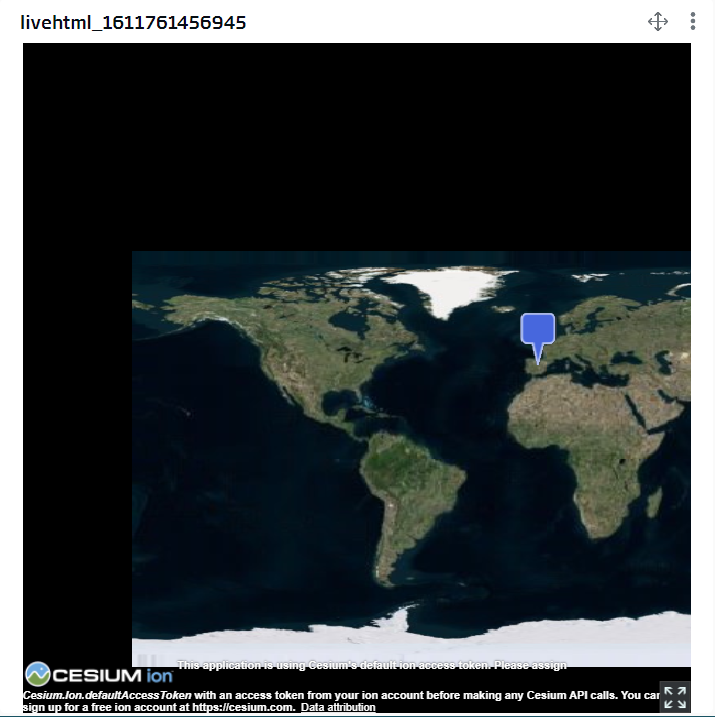
If in the line where we load the JSON, we put it all as a parameter of another function called «viewer.zoomTo()», we will be able to modify the viewer view toward our data:
viewer.zoomTo((Cesium.GeoJsonDataSource.load(myJSON)));
Better, isn’t it?
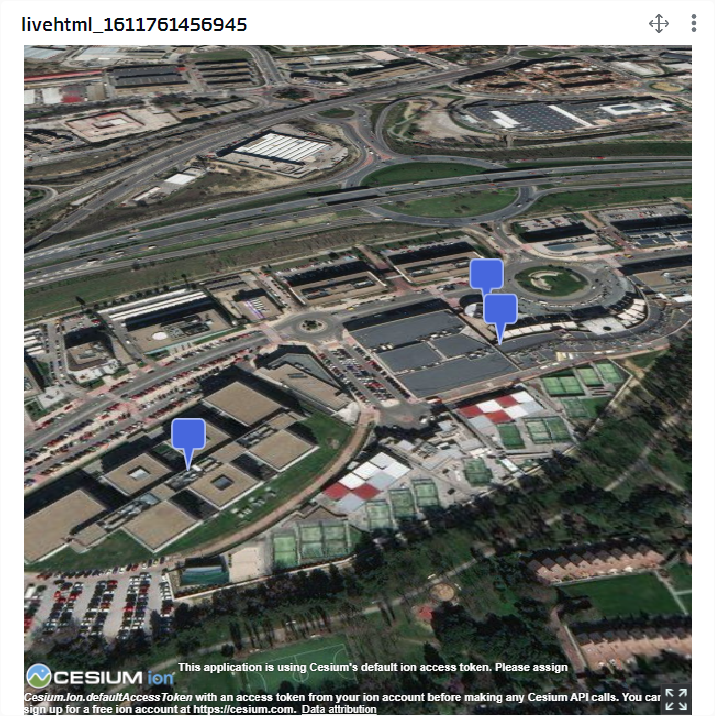
Now let’s talk about good practices: What we’ve done works, but it’s better if we define a variable with this layer, and pass that variable to the zoom function:
let layer = (Cesium.GeoJsonDataSource.load(myJSON));

viewer.zoomTo(layer);
This has an advantage, and that is that by defining the layer as a variable, it allows us to do more things to it. For example, we can hide it and show it by using the «show» property of the layer.
To see how it works, let’s set an interval to show it and hide it every second. So as to not leave this as idle talk, it is necessary to program it with this in mind:
layer.then(lyr => {
   setInterval(() => {
      // Check if the show property is true
      if (lyr.show) {
         lyr.show = false
      } else {
         lyr.show = true
      }
   }, 1000);
})
It may not be the prettiest example ever, but it sums up the idea perfectly.
To finish off, let’s remove the viewer’s layer, which is something that isn’t usually discussed much but is also very useful.
If you remember, to add the layer we used the function «viewer.dataSources.add()». In this case, we will use a very similar one: «viewer.dataSources.remove()», passing as parameter the layer we have declared.
Modifying the previous contramption, we are going to add a three-second wait, then remove the layer we have declared.
    layer.then(lyr => {
        // setInterval(() => {
        //     if (lyr.show) {
        //         lyr.show = false
        //     } else {
        //         lyr.show = true
        //     }
        // }, 1000);

        setTimeout(() => {
            viewer.dataSources.remove(lyr)
        }, 3000);
    })
Well, that’s it. This is the end of this easy tutorial on how to load the Cesium libraries, generate a small viewer, configure it and do some basic operations.
This is just a glimpse of the possibilities that these viewers have, but it is a good start to get an idea. The potential of this map viewer is huge, and that is why we support it in the Onesait Platform.
If you are interested in generating your own viewer, but without having to program anything, you always have the option of using our Platform viewers, which you can find in the Visualization & GIS > My GIS Viewers menu.
If you are interested in doing it this other way, we have another tutorial that surely will be useful for you.
We hope you found this post interesting, and we’ll see you next week to talk about OpenLayers.
If something is not clear, or if you want to add anything else, please leave us a comment.


Pingback: Map viewers (Part IV): Leaflet – Onesait Platform Blog
Pingback: Map viewers (Part I): Main Open Source libraries – Onesait Platform Blog
Pingback: Map viewers (Part III): OpenLayers – Onesait Platform Blog