
Map viewers (Part IV): Leaflet
And finally here we come to the last entry in our series of OpenSource map viewers. We have already seen CesiumJS and OpenLayers, and today we will see Leaflet.
As we said at the beginning, Leaflet is a distributed library with BSD-2 license, oriented to represent maps in two dimensions, which makes it quite similar to the OpenLayers library.
Its main advantages are its lightweightness, its ease of use and the good visual result it generates, since of the three libraries seen, this is the one that best represents the symbology.
Although it is a 2D library, as in the case of OpenLayers, it is possible to make use of certain extensions that allow the map to be visualised in an isometric view.
One of these extensions is WRLD3D (formerly eegeo), which although it is not Open Source, includes a free license level. For simple projects, it can be useful.
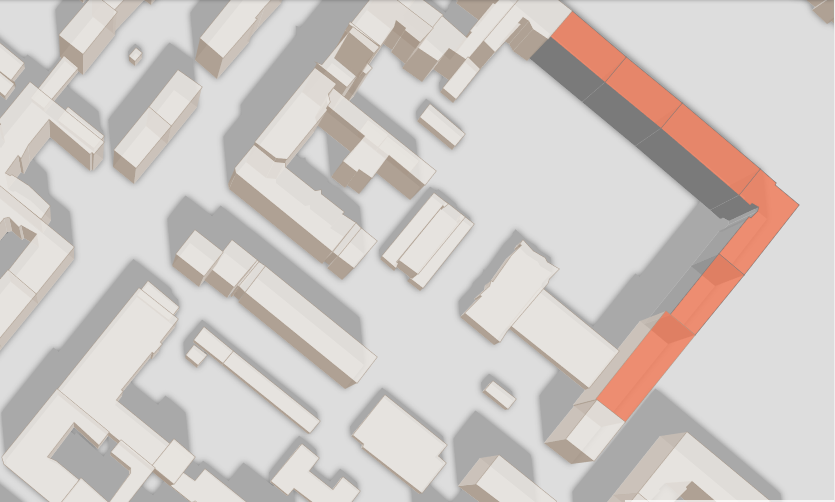
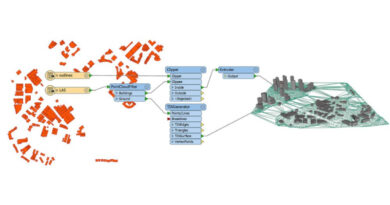
Another possibility is OSMBuildings; although it maintains a 2D visualisation, it includes three-dimensional geometries that generate the depth effect:
Using the library
As in the previous libraries, we have different options to use Leaflet:
- Download and/or install it.
- Use an external live programming environment.
- Consuming it via URL.
Downloading and/or installing it
As of the date of this entry’s publication, the version of the library is 1.7.1, which we can download from the Leaflet website along with its styles.
Once we have it locally downloaded, we only have to link it in our HTML and we will be able to work directly with it, without the need to build web environments as we had to with Cesium.
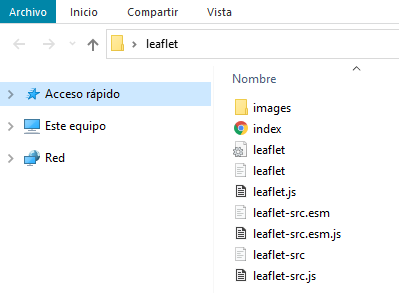
Here, as we will see, there are several files similar to each other. The important ones are:
- leaflet.js: the library’s minified JavaScript code.
- leaflet-src.js: the unminified code, with debubbing aids.
- leaflet.css: the library’s style sheet.
- images: the folder with the default images used by Leaflet. It must be located at the same level as the CSS file.
Note: although we will discuss it again later, it is very important to include the stylesheets before the JavaScript library.
The other possibility is to use NPM, installing the dependencies by using:
npm i leafletExternal live programming environment
If you remember, in Cesium you had our own development environment, called Sandcastle, where you could test the codes and see the examples.
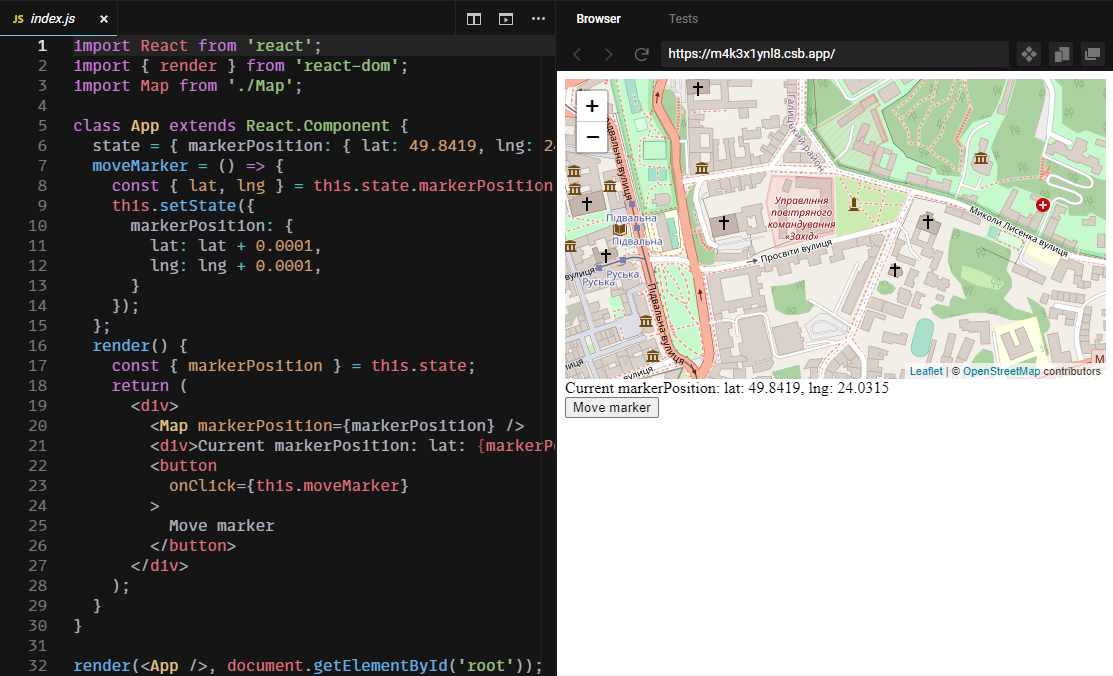
Then in OpenLayers, although you didn’t have your own environment, you could use CodeSandbox to show examples and to be able to modify the code.
In the case of Leaflet, you don’t have any of this; neither your own environment, nor a recommended environment, nor anything else. Still, you can use either CodeSandbox or JSFiddle or any other online IDE you like to prepare map viewers with Leaflet, although without the examples or guides for the other two libraries.
Mind, you, there is a group where you can see some examples and do your own forks to mess around with the examples, but it’s not official and doesn’t come close to what we’ve seen so far.
Consuming the library via URL
As in previous cases, this is the way we are going to work. To do so, we will use one of the CDNs available for Leaflet: unpkg, cdnjs or jsDelivr.
As it doesn’t really matter which one we choose, for this tutorial we will use cdnjs because its URLs are the easiest to copy:
Como da un poco igual cual escojamos, para este tutorial usaremos el de cdnjs por ser el más sencillo de copiar sus URLS:
https://cdnjs.cloudflare.com/ajax/libs/leaflet/1.7.1/leaflet.js
https://cdnjs.cloudflare.com/ajax/libs/leaflet/1.7.1/leaflet.css
Working environment
Here we repeat what we did in the previous two entries: we are going to use CloudLab, Onesait Platform’s free testing environment, where you can test all of the Platform’s capabilities without any limitation.
The modus operandi will be the same as always; we are going to set up a Dashboard with a Gadget that includes the map, to get something similar to this:
Yes, stuff’s blinking here too.
Loading the libraries
In the Dashboard configurator, enter the URLs of the stylesheet and of the JavaScript library (if you don’t remember how to do it, I explained it in part II of this series).
<link href="https://cdnjs.cloudflare.com/ajax/libs/leaflet/1.7.1/leaflet.css" rel="stylesheet">

<script src="https://cdnjs.cloudflare.com/ajax/libs/leaflet/1.7.1/leaflet.js"></script>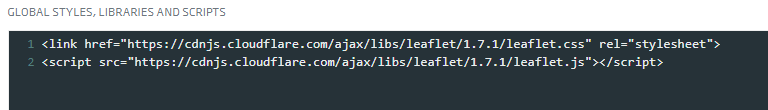
As in the previous cases, you are going to use a «Template»-type Gadget, where you can prepare both the HTML and CSS of the map’s Frontend part, as well as the JavaScript part to prepare the viewer’s Backend.
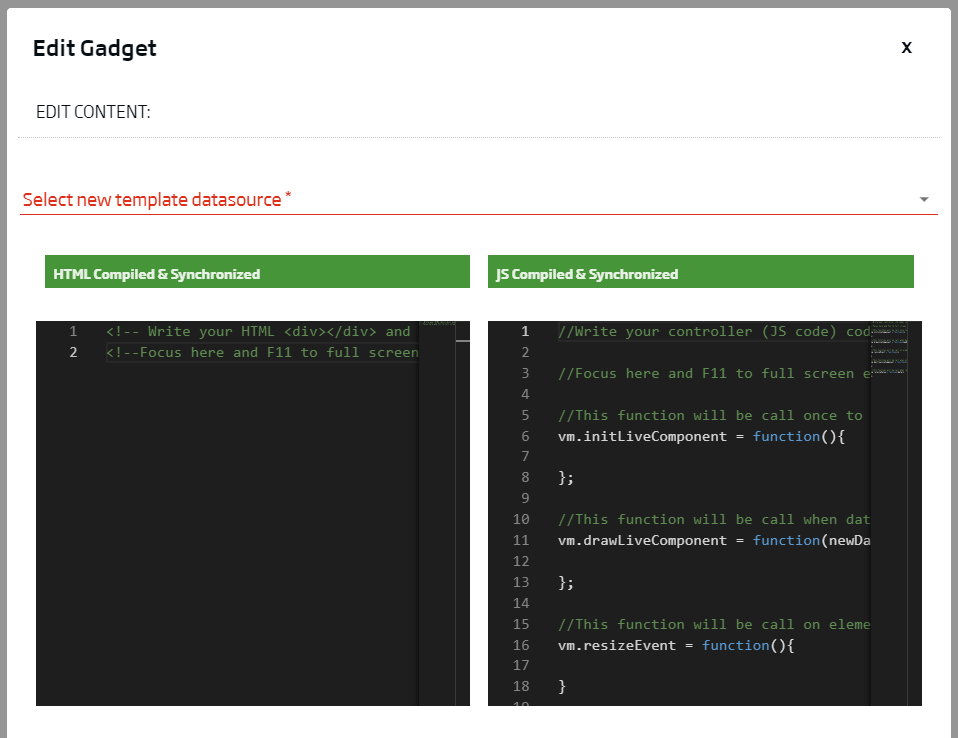
Generating the Leaflet map
Let’s start with the good part: creating your map viewer.
Following the scheme of the previous cases, in the HTML part, you are going to create a container in the left window with the following name:
<div id="leafletContainer" class='leafletContainer'></div>To make it as similar as possible to the other maps, you are also going to generate some styles:
<style>
  .leafletContainer {
    height: 100%;
    width: 100%;
  }
</style>

<div id="leafletContainer" class='leafletContainer'></div>
Once this is done, you will generate the JavaScript code that generates the map viewer in the window to the right. Create a variable called «viewer», which you will use with the Leaflet map constructor as follows:
//This function will be call once to init components
vm.initLiveComponent = function () {

    let viewer = L.map('leafletContainer')

}
Once you sync and compile the Gadget, the map viewer will be generated. However, although the zoom controllers appear at the top left, and the Leaflet attribution at the bottom right, in general you will see everything in grey and blank.
This is because, as with OpenLayers, you need to include the starting information of the camera, as well as some layer to visualise, specifically to visualize the base map to know where we are visually.
To add the base map, you should use the «tileLayer()» class, adding as the input parameter the URL of the OpenStreetMap base map service:
//This function will be call once to init components
vm.initLiveComponent = function () {

    let viewer = L.map('leafletContainer')

    L.tileLayer('https://{s}.tile.openstreetmap.org/{z}/{x}/{y}.png').addTo(viewer)
};
Synchronising and compiling again, you’ll see that everything is still grey, and this is because, as we have already mentioned, it is essential to include the coordinates and the zoom level for the initial view.
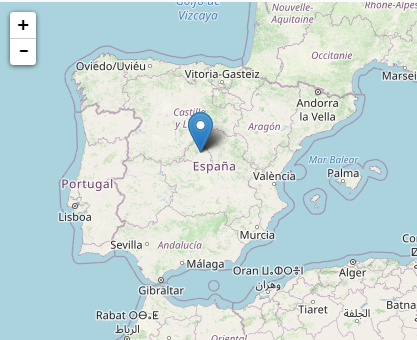
This is done using the «setView()» method. As in previous cases, we will introduce the coordinates to visualise Spain.
//This function will be call once to init components
vm.initLiveComponent = function () {

    let viewer = L.map('leafletContainer')

    L.tileLayer('https://{s}.tile.openstreetmap.org/{z}/{x}/{y}.png').addTo(viewer)

    viewer.setView([-3, 40], 5)
};
That’s it. We compile the code and we have our viewer focused on… Kenya?
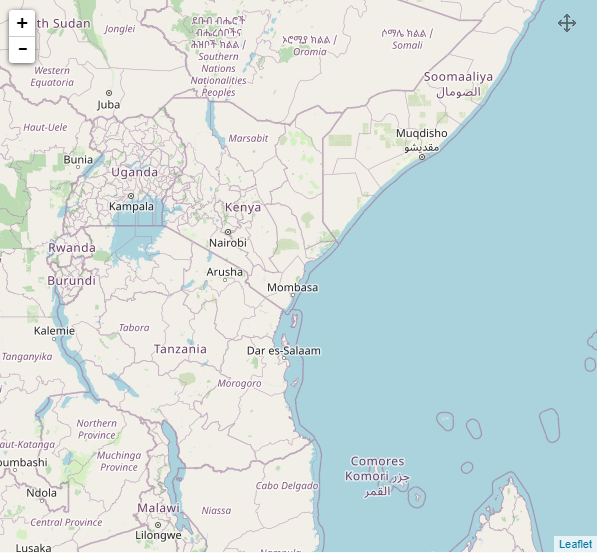
Well, d’uh! The coordinates [-3 , 40] refer to a location near Mombasa because in Leaflet, unlike in Cesium or OpenLayers, the coordinates are entered as latitude and longitude, not longitude and latitude. This may seem a trifle, but it creates a lot of problems later if we don’t take it into account.
Are there any solutions? Well, we have a few:
- Modifying the original data, which, if it comes from a service used in other browsers, will generate a similar problem to the current one in those browsers.
- Parsing the coordinates object, to invert the order from Front. We don’t touch the original data, but it’s still a bit messy.
- Making use of the GeoJSON.coordsToLatLng() class method.
This method, designed to work with a GeoJSON, intelligently parses the coordinates you indicate, fixing the little problem you had.
//This function will be call once to init components
vm.initLiveComponent = function () {
    let viewer = L.map('leafletContainer')

    L.tileLayer('https://{s}.tile.openstreetmap.org/{z}/{x}/{y}.png', {
        attribution: false,
    }).addTo(viewer)

    viewer.setView(L.GeoJSON.coordsToLatLng([-3, 40]), 5)

    setTimeout(() => {
        viewer.invalidateSize()
    }, 100)
}
Now, here it is, our viewer focuses on the point we were interested in from the beginning.
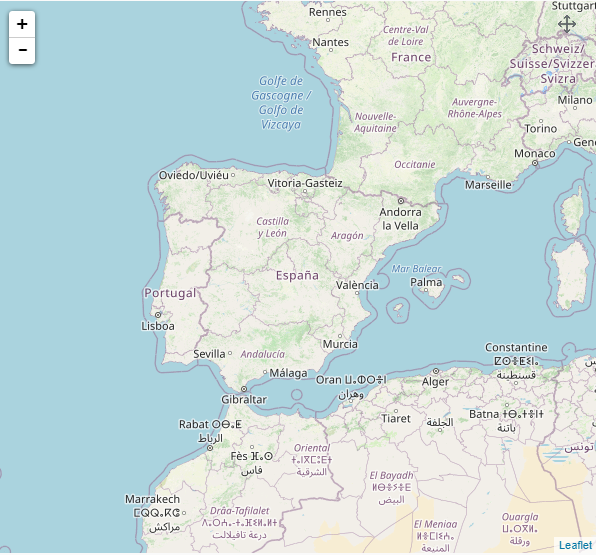
As in the case of OpenLayers, introduce a timeout with a function that serves to keep the map adjusted to the size of the Gadget. This is not necessary if you are going to have the map in a static window, but in the case of Dashboard Gadgets, where we usually change sizes, it is a good practice.
//This function will be call once to init components
vm.initLiveComponent = function () {

    let viewer = L.map('leafletContainer')

    L.tileLayer('https://{s}.tile.openstreetmap.org/{z}/{x}/{y}.png', {
        attribution: false,
    }).addTo(viewer)

    viewer.setView(L.GeoJSON.coordsToLatLng([-3, 40]), 5)

    setTimeout(() => {
        viewer.invalidateSize()
    }, 100)
}
Possible map viewer configurations
The way Leaflet is designed, we find a bazillion configuration options for the map object.
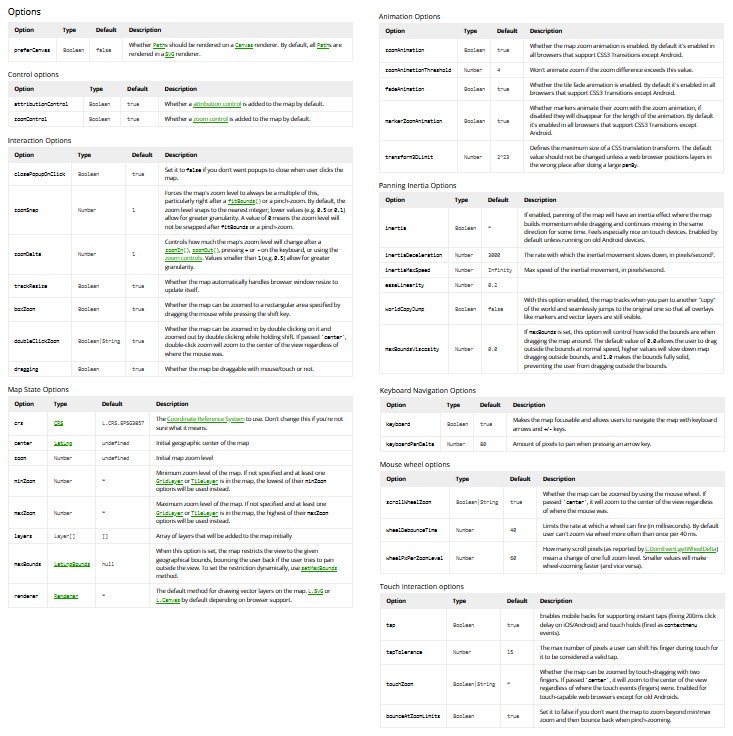
As in OpenLayers, we differentiate between general properties, controls and interactions, as well as animations, map scroll inertia effects, navigation, mouse wheel options and even touch options.
The most common general properties include:
- crs: the reference coordinate system; in other words, the system in which the data will be projected. This viewer supports the most common ones (read more):
- EPSG:4326: the one used by GPS, considering the entire planetary surface.
- EPSG:3857: the so-called Pseudo-Mercator, similar to the previous one, but with the poles clipped between 85.06ºN and 85.06ºS.
- EPSG:3395: some weird doohickey that also starts from 4326, but omits outside 84ºN and 80ºS. The documentation says it is used for some basemap providers.
- center: the coordinates, in latitude and longitude format, of the initial position of the map. This is another option, different to the one we have used before.
- zoom: the initial zoom level. The same as in the previous option.
- minZoom: this option allows you to limit the minimum zoom of the map.
- maxZoom: this option, similar to the previous one, allows you to limit the maximum zoom of the map in this case.
- layers: this array allows to preload layers (the constructor would be introduced in this option).
- maxBounds: with this we limit the lateral displacement of the camera to the interior of certain coordinates. It is a good option to limit the view to a specific area (a country, a city, etc.).
- renderer: the rendering method to be used, differentiating between Canvas or SVG.
In the case of controls, there are only two options:
- attributionControl: to include the property information of the map contents.
- zoomControl: to show or hide the zoom buttons.

About the interactions, there are many, among which I highlight these:
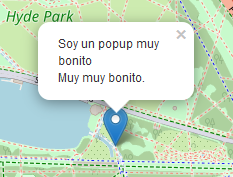
- closePopupOnClick: to close or keep popups open when clicking on the map.
- doubleClickZoom: which activates or deactivates zooming when double clicking on the map (or even with the finger in screenshots).
- dragging: this option controls the scrolling of the map when you click and hold on the map.
As we can see, by default we don’t have drawing tools, but they do exist. So, we found a drawing API documented on GitHub, with its button panels and stuff.
There are more configuration options, but say the ones we have seen are the main ones to get started and make a practical map viewer.
Loading a layer
It seems it always takes us a while to get to this part, but here we are. Once we have the map working and configured to our liking, we move on to putting a real vector layer on it.
Let’s keep reusing our usual example about the points of interest:
{
  "type": "FeatureCollection",
  "features": [
    {
      "type": "Feature",
      "properties": {
        "id": "Work"
      },
      "geometry": {
        "type": "Point",
        "coordinates": [
          -3.641436696052551,
          40.529066557739924
        ]
      }
    },
    {
      "type": "Feature",
      "properties": {
        "id": "Lunch"
      },
      "geometry": {
        "type": "Point",
        "coordinates": [
          -3.6394304037094116,
          40.53058739857294
        ]
      }
    },
    {
      "type": "Feature",
      "properties": {
        "id": "Beer"
      },
      "geometry": {
        "type": "Point",
        "coordinates": [
          -3.639392852783203,
          40.530179669832364
        ]
      }
    }
  ]
}
We’ll add this GeoJSON to our Gadget’s JavaScript code as a variable, which we’ll call later.
As previously mentioned, Leaflet is a fairly simple library, so adding a layer is as easy as using the «GeoJson()» method:
//This function will be call once to init components
vm.initLiveComponent = function () {

    let viewer = L.map('leafletContainer')

    L.tileLayer('https://{s}.tile.openstreetmap.org/{z}/{x}/{y}.png', {
        attribution: false,
    }).addTo(viewer)

    viewer.setView(L.GeoJSON.coordsToLatLng([-3, 40]), 5)

    const myJSON = {... aquí vendría el GeoJSON ...}

    let layer = L.geoJson(myJSON).addTo(viewer)

    setTimeout(() => {
        viewer.invalidateSize()
    }, 100)
}
Easy, right? Besides, by using «GeoJson()» directly, we make sure that the coordinates are included correctly.
Having done that, by compiling the Gadget you will have the points represented on the map.
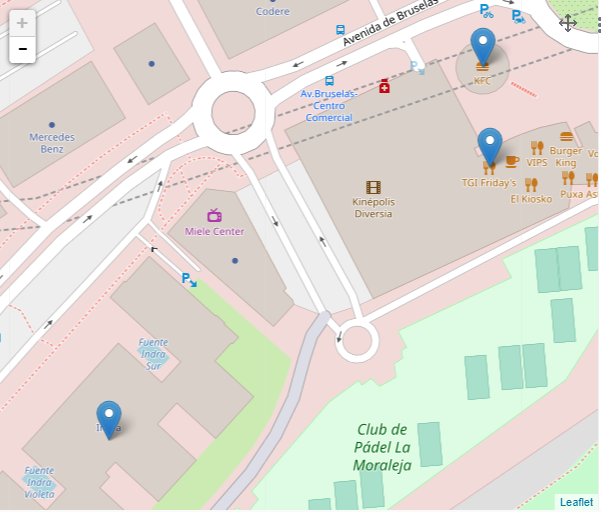
As usual, you can more or less see where the points are, but little else. So let’s zoom in a bit to see them better.
You had defined the layer as a variable, and that allows you to interact with that layer directly. So, by using the «fitBounds()» method of the map viewer, and the «getBounds()» of the layer, you can zoom directly to the layer:
//This function will be call once to init components
vm.initLiveComponent = function () {

    let viewer = L.map('leafletContainer')

    L.tileLayer('https://{s}.tile.openstreetmap.org/{z}/{x}/{y}.png', {
        attribution: false,
    }).addTo(viewer)

    viewer.setView(L.GeoJSON.coordsToLatLng([-3, 40]), 5)

    const myJSON = {... aquí vendría el GeoJSON ...}

    let layer = L.geoJson(myJSON).addTo(viewer)

    setTimeout(() => {
        viewer.invalidateSize()

        viewer.fitBounds(layer.getBounds())
    }, 100)
}
Include the zoom to the layer within the timeout because of the minimal but existing time needed to generate the layer. Like OpenLayers and unlike Cesium, Leaflet does not work based on promises, so you have to generate them yourself. But for the sake of simplicity, use this form.
Now you can see your layer at a good zoom level, and you can see that the points are well differentiated, unlike what happened with OpenLayers and its default symbology.
That’s it, we only have to blink the points layer, as in previous cases.
But, in Leaflet, this concept is somewhat different. You cannot hide the layers and then show them again. Instead, you have to modify their opacity or, as it is usually done, delete the layer and mount it again.
In code, this would be:
//This function will be call once to init components
vm.initLiveComponent = function () {

    let viewer = L.map('leafletContainer')

    L.tileLayer('https://{s}.tile.openstreetmap.org/{z}/{x}/{y}.png', {
        attribution: false,
    }).addTo(viewer)

    viewer.setView(L.GeoJSON.coordsToLatLng([-3, 40]), 5)

    const myJSON = {... aquí vendría el GeoJSON ...}

    let layer = L.geoJson(myJSON).addTo(viewer)

    setTimeout(() => {
        viewer.invalidateSize()
        viewer.fitBounds(layer.getBounds())
    }, 100)

    setTimeout(() => {
        setInterval(() => {
            if (layer) {
                viewer.removeLayer(layer)
                layer = null
            } else {
                layer = L.geoJson(myJSON).addTo(viewer)
            }
        }, 1000);
    }, 100)
}
Not bad, uh? As you can see, anything can be done with either map viewer. You just have to find the right way to do it for each one.
We are not going to explain how to delete a layer, because that is precisely how we achieve this visual effect of appearing and disappearing.
To close up, we leave the complete code of both the HTML and JavaScript boxes, in case you want to just copy and paste it into your Gadget directly and check that it indeed works.
HTML/CSS
<!-- Write your HTML <div></div> and CSS <style></style> here -->
<!--Focus here and F11 to full screen editor-->
<style>
  .leafletContainer {
    height: 100%;
    width: 100%;
  }
</style>

<div id="leafletContainer" class='leafletContainer'></div>
JavaScript
//Write your controller (JS code) code here
//Focus here and F11 to full screen editor

//This function will be call once to init components
vm.initLiveComponent = function () {

    window.viewer = L.map('leafletContainer')

    L.tileLayer('https://{s}.tile.openstreetmap.org/{z}/{x}/{y}.png', {
        attribution: false,
    }).addTo(viewer)

    viewer.setView(L.GeoJSON.coordsToLatLng([-3, 40]), 5)

    const myJSON = {
        "type": "FeatureCollection",
        "features": [
            {
                "type": "Feature",
                "properties": {
                    "id": "Work"
                },
                "geometry": {
                    "type": "Point",
                    "coordinates": [
                        -3.641436696052551,
                        40.529066557739924
                    ]
                }
            },
            {
                "type": "Feature",
                "properties": {
                    "id": "Lunch"
                },
                "geometry": {
                    "type": "Point",
                    "coordinates": [
                        -3.6394304037094116,
                        40.53058739857294
                    ]
                }
            },
            {
                "type": "Feature",
                "properties": {
                    "id": "Beer"
                },
                "geometry": {
                    "type": "Point",
                    "coordinates": [
                        -3.639392852783203,
                        40.530179669832364
                    ]
                }
            }
        ]
    }

    let layer = L.geoJson(myJSON).addTo(viewer)

    setTimeout(() => {
        viewer.invalidateSize()
        viewer.fitBounds(layer.getBounds())
    }, 100)

    setTimeout(() => {
        setInterval(() => {
            if (layer) {
                viewer.removeLayer(layer)
                layer = null
            } else {
                layer = L.geoJson(myJSON).addTo(viewer)
            }
        }, 1000);
    }, 100)
};

//This function will be call when data change. On first execution oldData will be null
vm.drawLiveComponent = function (newData, oldData) {

};

//This function will be call on element resize
vm.resizeEvent = function () {

}

//This function will be call when element is destroyed
vm.destroyLiveComponent = function () {

};

//This function will be call when receiving a value from vm.sendValue(idGadgetTarget,data)
vm.receiveValue = function (data) {

};
So that’s it. Now you know how to start assembling a map with Leaflet.
With this we also finish this series about map viewers with Open Source libraries. We hope you found them interesting and that you can make good use of them.
If you have any questions or problems, please leave a comment and we will get back to you as soon as possible.

Pingback: Map viewers (Part I): Main Open Source libraries – Onesait Platform Blog