
Map viewers (Part III): OpenLayers
Following on from last week, when we talked about the CesiumJS library as an OpenSource map viewer, today we are going to talk about the OpenLayers library.
This other library, distributed under BSD-2 license, focuses on displaying geospatial information exclusively in 2D – although, as we will see later on, a plugin can be included to generate a 3D visualisation.
This library’s main potential is the ability to represent the layers in a humungous number of different projection systems, something very useful if you work in a very local area.
It also has an extensive gallery of examples for the viewer, such as interaction elements, loading different types of layers or making use of other external libraries such as turf.js – to which a blog user recently made reference in the comments.
Using the library
As in the previous library, we have different options to use OpenLayers:
- Downloading and/or installing it.
- Using the CodeSandbox environment.
- Consuming it via URL.
Downloading and/or installing it
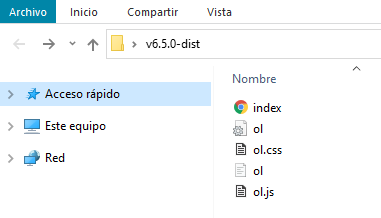
The version available at the time of publishing this post is 6.5.0. You can download in either of two versions:
Using it is as simple as unzipping the library and styles in a folder, generate an HTML file where you link the library and the stylesheet, and off you go.
Another option is to install the library using NPM:
npm install olThis will install the library in the project folder we have defined, being able to import only the classes we are going to use instead of the whole library, and thus optimising our code.
CodeSandbox environment
The OpenLayers website does not offer an interactive programming environment as Cesium had with its Sandcastle, so the examples it shows are all static.
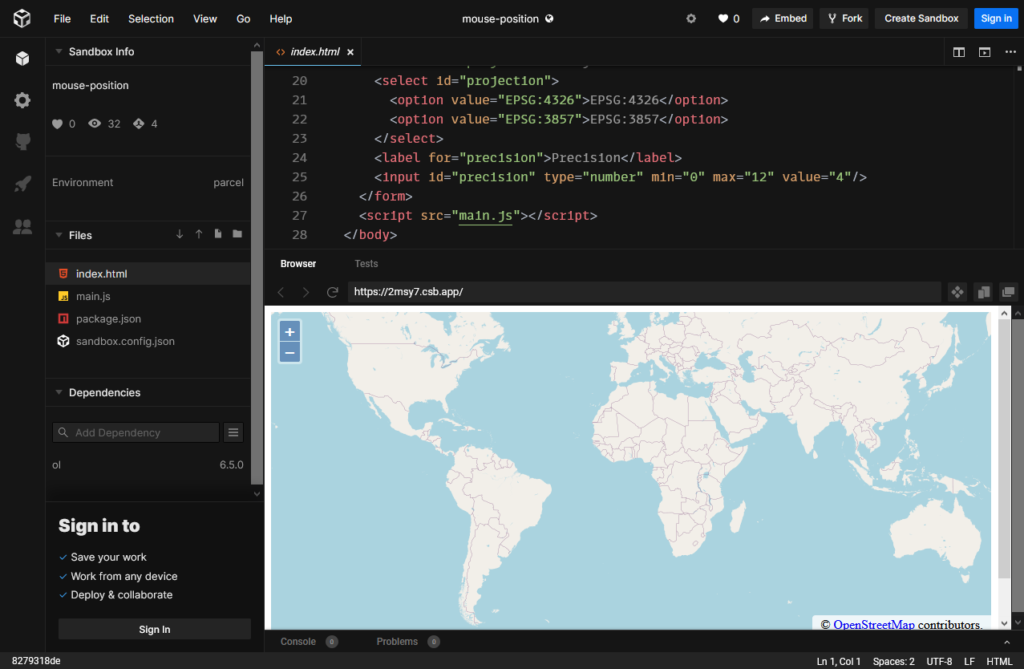
However, there is the possibility of using CodeSandBox, the instant IDE and prototyping tool, to modify the examples and see the changes that are made (as with our own GIS Viewer editor of the Platform).
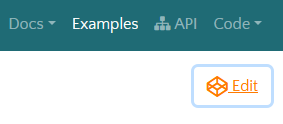
To do this, when you are in an example that you are interested in modifying, you only have to click on the «Edit» button, at the top right of the screen, to launch CodeSandBox (you must have enabled the opening of tabs/windows).
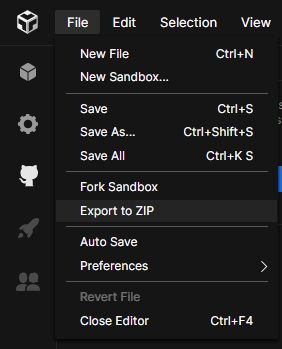
Then, from this tool, you can share or embed your maps wherever you want, or even download a ZIP file with all the code, so you can do whatever you need with it.
Consuming the library via URL
The last option is to make use of the library’s URLs directly: Instead of linking to our folder with the downloaded library, you will link directly to the OpenLayers repository.
As in the case of the other viewers, this will be the option we will use for this tutorial.
Working environment
To carry out this tutorial, you will again make use of Onesait Platform‘s CloudLab web environment which, as you already know, is free and where you can test all the capabilities of the Platform without any limitation.
As in last week, you are going to generate a Dashboard with a Gadget. The Gadget will contain the map and it’ll be where you will be able to experiment in a quick and easy way.
If everything goes well, you will get a Dashboard like this:
Loading the libraries
As we have already said, we are going to use the library available from the OpenLayers repository, which corresponds to the styles and functionalities:
https://cdn.jsdelivr.net/gh/openlayers/openlayers.github.io@master/en/v6.5.0/css/ol.css
https://cdn.jsdelivr.net/gh/openlayers/openlayers.github.io@master/en/v6.5.0/build/ol.js
Dashboard Generation and Gadget Preparation
The steps to generate the Dashboard and the Gadget are the same as the ones we saw in the post about CesiumJS, so if you have any doubt about how to do it, check that post.
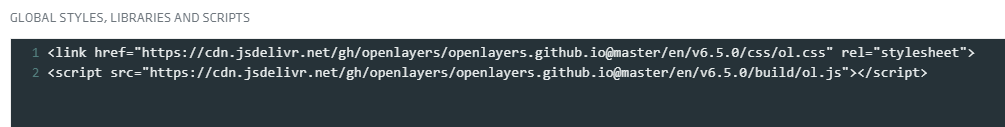
The only thing to take into consideration here is to include the correct URLs in the Dashboard configuration:
<link href="https://cdn.jsdelivr.net/gh/openlayers/openlayers.github.io@master/en/v6.5.0/css/ol.css" rel="stylesheet">

<script src="https://cdn.jsdelivr.net/gh/openlayers/openlayers.github.io@master/en/v6.5.0/build/ol.js"></script>
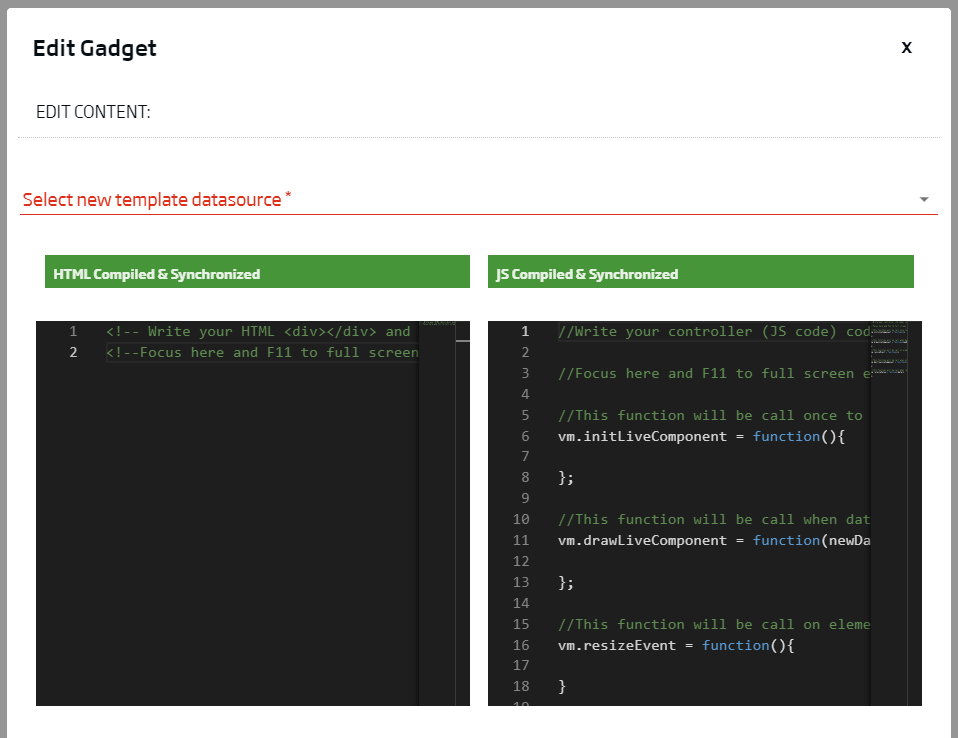
Remember also that you will use a Gadget of «Template» type to program both the Front of the map with HTML and CSS, and its logic with JavaScript.
Generating the OpenLayers map
Once you have everything ready, it’s time to get down to work and prepare our first map.
You’ll start by generating the viewer’s visual part, creating a container in the HTML part (the one on the left, okay?). We will call it in a similar way as we did in the previous post, to get some homogeneity:
<div id="openLayersContainer"></div>You will also codify a bit the styles of the container, so that it looks pretty and cool. Specifically, you will define a total width and height for the container, so that it fills the Gadget’s entire area:
<style>
  .openLayersContainer {
    height: 100%;
    width: 100%;
  }
</style>

<div id="openLayersContainer" class='openLayersContainer'></div>
Now, let’s program the logic part in the JavaScript part (the one on the right). Look for the «vm.initLiveComponent» function, and inside it, create a variable called «viewer», as I’m showing you below:
//This function will be call once to init components
vm.initLiveComponent = function () {

    let viewer = new ol.Map({
        target: 'openLayersContainer',
        layers: [
            new ol.layer.Tile({
                source: new ol.source.OSM()
            })
        ],
        view: new ol.View({
            center: ol.proj.fromLonLat([-3, 40]),
            zoom: 5
        })
    })

}
Let’s explaining the code a bit. What you will do here is to define a variable, called «viewer» that will generate the map in the «div» that you define as «target», which in this case will be «openLayersContainer».
In this map, you will load an initial layer corresponding to the OpenStreetMaps base map. Each layer created will go to the «layers» array – you can include a layer as such or the layer constructor; in this case, we do the later.
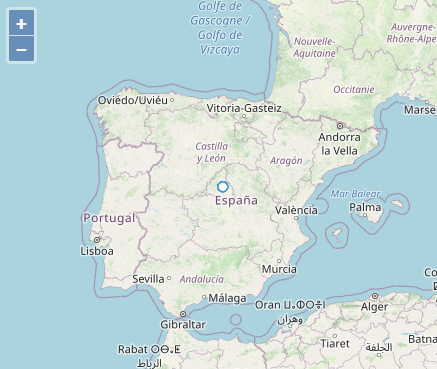
Finally, you will define an initial view using the «view» property, specifying where you want the map to focus («centre»), specifying a longitude and latitude, and at what altitude («zoom») you want the camera to be.
Unlike Cesium, which presents a preset of properties, in OpenLayers you must input these properties in the viewer’s constructor, otherwise you will see nothing on the screen. These three properties are the minimum needed, but as you will see, there are many others that can be added.
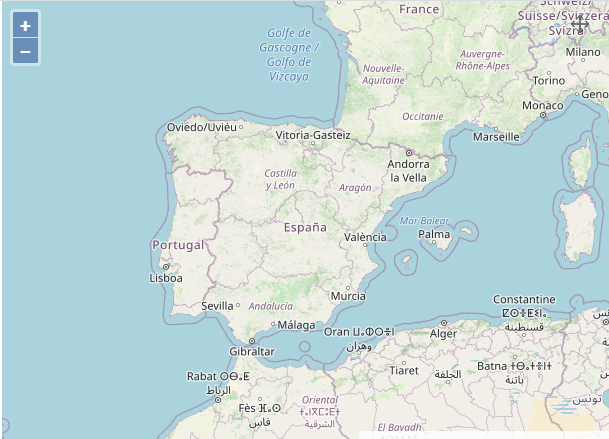
Having introduce these properties, if you synchronise and compile the Gadget, it should look like this (depending on the screen size, of course):
In the particular case of this representation in Dashboads, it is necessary to introduce some code to make sure that, at all times, the map container adapts to the screen size.
So, after defining the «viewer», you must introduce this code:
setTimeout(function () { viewer.updateSize() }, 100)With this, you ensure that the viewer loads perfectly, regardless of the size of the browser screen or the changes that are made.
Possible map viewer configurations
As I have already mentioned, when creating the viewer you have to enter some minimum properties, but there are more, although not as many as we found in Cesium:
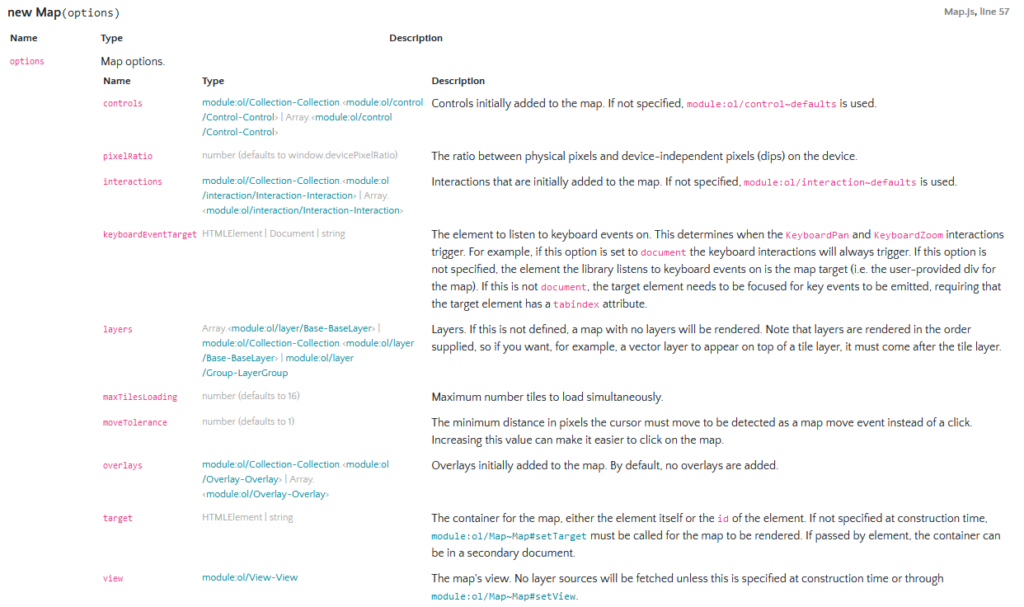
Click on the image to see the list, ‘coz we still can’t see a thing at this size.
The most important properties are the ones we have already defined, so I will only mention a couple that are frequently useful for optimisation purposes:
- pixelRatio: in short, the resolution you want the map to have (the dips, that is).
- maxTilesLoading: the number of tiles that will be loaded at the same time (the square images in the base map, for example).
Beyond that, there are other options that, although not properties as such, are useful to know. I am talking specifically to «controls», «interactions» and «overlays».
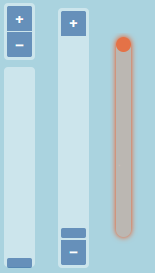
Controls are those elements of the map’s UI with which we interact. This option groups the array of controls loaded in the map, differentiating between:
- Attribution: with the attribution information of the layers and contents of the map.
- FullScreen: the option that allows us to view the map in full screen.
- MousePosition: which shows the coordinates corresponding to the position of the mouse on the map. This is very used.
- OverviewMap: this controller creates a minimap showing the position of the main viewer.
- Rotate: this option allows you to rotate the orientation of the map (by default it points north).
- ScaleLine: the map’s graphical scale. It has an option to show the numerical scale.
- ZoomSlider: this control activates a selection bar to modify the zoom of the map.
- ZoomToExtent: activates a button that, once clicked, moves the map camera to the position and zoom defined in the input parameters.
- Zoom: manages the zoom (+) and zoom (-) buttons of the map.
On the other hand, the interactions refer to those functionalities that generate modifications in the map. Here we find:
- DoubleClickZoom: when double clicking with the mouse on a point, the option to zoom in (+) is enabled.
- DragAndDrop: this option allows detecting when something has been dragged over the map and dropped into it. A common example of this is dragging a GeoJSON onto the map, and retrieving it with this interaction.
- KeyboardPan: this would allow you to pan the map using the keyboard arrow.
- KeyboardZoom: similar to the previous one, but to modify the view camera’s zoom.
- MouseWheelZoom: by default, by moving the mouse wheel we zoom in or out. With this interaction we can change the behaviour of the wheel.
- PointerInteraction: this interaction receives the response of the mouse «click», «move» or «release» events.
- Select: to select map elements and retrieve their information.
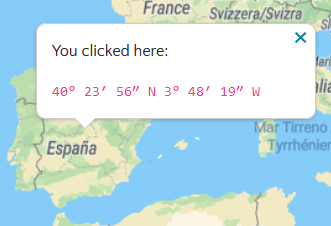
Finally, I have to comment on the overlay options, which, as its name suggests, is what is superimposed on the map, such as a pop-up window. Here we do not find different types, but insetad any HTML element that you configure will be an overlay.
Loading a layer
Now that we know what OpenLayers is about and how we can customise it, let’s get to the interesting part: loading a layer with data.
As in the previous case, we are going to make use of the GeoJSON format, using the same example:
{
  "type": "FeatureCollection",
  "features": [
    {
      "type": "Feature",
      "properties": {
        "id": "Work"
      },
      "geometry": {
        "type": "Point",
        "coordinates": [
          -3.641436696052551,
          40.529066557739924
        ]
      }
    },
    {
      "type": "Feature",
      "properties": {
        "id": "Lunch"
      },
      "geometry": {
        "type": "Point",
        "coordinates": [
          -3.6394304037094116,
          40.53058739857294
        ]
      }
    },
    {
      "type": "Feature",
      "properties": {
        "id": "Beer"
      },
      "geometry": {
        "type": "Point",
        "coordinates": [
          -3.639392852783203,
          40.530179669832364
        ]
      }
    }
  ]
}
We will load this JSON by adding the following lines of code:
//This function will be call once to init components
vm.initLiveComponent = function () {

    let viewer = new ol.Map({
        target: 'openLayersContainer',
        layers: [
            new ol.layer.Tile({
                source: new ol.source.OSM()
            })
        ],
        view: new ol.View({
            center: ol.proj.fromLonLat([-3, 40]),
            zoom: 5
        })
    })

    const myJSON = {... aquí vendría el GeoJSON ...}

    let vectorSource = new ol.source.Vector({
        features: new ol.format.GeoJSON().readFeatures(myJSON, {
            featureProjection: 'EPSG:3857',
        }),
    })

    let vectorLayer = new ol.layer.Vector({
        source: vectorSource
    })

    viewer.addLayer(vectorLayer)

}
Here what we do is, first of all, generate a data source with the constructor «ol.source.Vector()», passing the GeoJSON as entities and specifying its projection system.
Once the data source is generated, we create a vector layer with it using «ol.layer.Vector()».
Finally, we make use of the layer loading method «addLayer()» of the map viewer, using the vector layer previously created.
Synchronising and compiling the Gadget, it should appear on the screen:
These three lines of code could be simplified into one, but I think it’s better to go little by little to understand it better. You also have to remember that if you load the GeoJSON from a service, you will have to consider doing something asynchronous so that it doesn’t fail.
As in the previous case, we have the layer loaded, but it is barely visible, due to the initial zoom conditions defined in the viewer. Can we zoom the newly loaded layer? Of course we can.
To do it, first get the extent of the points layer – that is, the box containing all the entities – and then zoom in to that extent.
The code, which should be included after the add layer function, would be as follows:
let layerExtent = vectorLayer.getSource().getExtent()
viewer.getView().fit(layerExtent)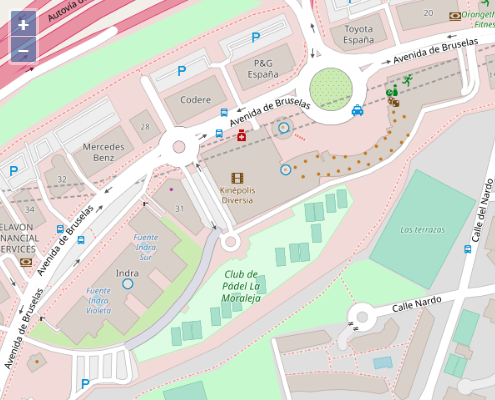
Well, here we have our points of interest on the map. Maybe they’re not very visible, but they are there. It is possible to change the symbology, but it is not something we are going to deal with in these tutorials.
If you remember from the Cesium entry, what we did now was to change the layer’s visibility property, making it blink every second. Well, we can do it here too.
The code would be as follows:
    setTimeout(function () {
        setInterval(() => {
            // Check if the show property is true
            if (vectorLayer.getVisible()) {
                vectorLayer.setVisible(false)
            } else {
                vectorLayer.setVisible(true)
            }
        }, 1000);
    }, 100)
As you will notice, there are similarities and differences with respect to the case of the other viewer.
OpenLayers does not create its layers with promises, as Cesium does, so it would be necessary to generate the asynchronous promise on our own. To avoid all that for the example, I have generated a timeout that makes the solve promise function for us.
On the other hand, obtaining the visibility of the layer is extremely simple, because OpenLayers includes a lot of functionalities that make it not necessary to go to the specific property to read its value, but simply to make the corresponding call.
In addition, to change the value of that property you have to use the «set» functionality, because if you do it directly, it won’t work.
Well, we have the layer loaded, now blinking, and the last point will be to remove it from the map. As in all cases (as you can see the viewers all work the same in general), we have the «removeLayer()» method.
Used with our layer, and repeating the three seconds thing before removing it, it would be like this:
    setTimeout(() => {
        viewer.removeLayer(vectorLayer)
    }, 3000);
That brings us to the end of our short tutorial on how to get started with OpenLayers. As you can see, there is no big deal if you know the URLs of the libraries and the main methods, since the rest is very similar to what we have already seen.
Here you have the complete JavaScript code that I have been generating, in case you prefer to do a Ctrl C/Ctrl V directly:
//Write your controller (JS code) code here
//Focus here and F11 to full screen editor

//This function will be call once to init components
vm.initLiveComponent = function () {

    let viewer = new ol.Map({
        target: 'openLayersContainer',
        layers: [
            new ol.layer.Tile({
                source: new ol.source.OSM()
            })
        ],
        view: new ol.View({
            center: ol.proj.fromLonLat([-3, 40]),
            zoom: 5
        })
    });

    setTimeout(function () {
        viewer.updateSize()
    }, 100)

    const myJSON = {
        "type": "FeatureCollection",
        "features": [
            {
                "type": "Feature",
                "properties": {
                    "id": "Work"
                },
                "geometry": {
                    "type": "Point",
                    "coordinates": [
                        -3.641436696052551,
                        40.529066557739924
                    ]
                }
            },
            {
                "type": "Feature",
                "properties": {
                    "id": "Lunch"
                },
                "geometry": {
                    "type": "Point",
                    "coordinates": [
                        -3.6394304037094116,
                        40.53058739857294
                    ]
                }
            },
            {
                "type": "Feature",
                "properties": {
                    "id": "Beer"
                },
                "geometry": {
                    "type": "Point",
                    "coordinates": [
                        -3.639392852783203,
                        40.530179669832364
                    ]
                }
            }
        ]
    }

    let vectorSource = new ol.source.Vector({
        features: new ol.format.GeoJSON().readFeatures(myJSON, {
            featureProjection: 'EPSG:3857',
        }),
    })

    let vectorLayer = new ol.layer.Vector({
        source: vectorSource
    })

    viewer.addLayer(vectorLayer)

    let layerExtent = vectorLayer.getSource().getExtent();
    viewer.getView().fit(layerExtent);

    setTimeout(function () {
        setInterval(() => {
            if (vectorLayer.getVisible()) {
                vectorLayer.setVisible(false)
            } else {
                vectorLayer.setVisible(true)
            }
        }, 1000);
    }, 100)

    // Uncomment this code and comment the above one to remove the layer after three seconds
    // setTimeout(() => {
    //     viewer.removeLayer(vectorLayer)
    // }, 3000);

}

//This function will be call when data change. On first execution oldData will be null
vm.drawLiveComponent = function (newData, oldData) { }

//This function will be call on element resize
vm.resizeEvent = function () { }

//This function will be call when element is destroyed
vm.destroyLiveComponent = function () { }

//This function will be call when receiving a value from vm.sendValue(idGadgetTarget,data)
vm.receiveValue = function (data) { }
We hope you found this post interesting, and we’ll see you next week to talk about Leaflet, the third of our Open Source map viewers.
If something is not clear, or if you want to add something else, please leave us a comment.
Pingback: Map viewers (Part I): Main Open Source libraries – Onesait Platform Blog
Pingback: Map viewers (Part IV): Leaflet – Onesait Platform Blog