Analysis of COVID-19 case evolution with the Platform: ingesting and loading in Open Data Portal
Introduction
In this article, we are going to show how to ingest data in the Platform to add them to the Onesait Open Data Portal that we have recently integrated. The data source to use will be the Open Data Portal of the Spanish Government. These are the steps to take:
- Ontology Modeling.
- Platform ingest flow using FlowEngine.
- Dataset and resource creation in CKAN.
- Data visualization and creation of views.
Ontology Modeling
First of all, you must model the format of the data you want to ingest into the Onesait Platform.
You want to know how the cases of COVID-19 have evolved throughout Spain. You can get the evolution in the city of Alcobendas the Open Data website. In the second part, you will cross the total number of cases and registrations per Autonomous Community from Datadista’s data.
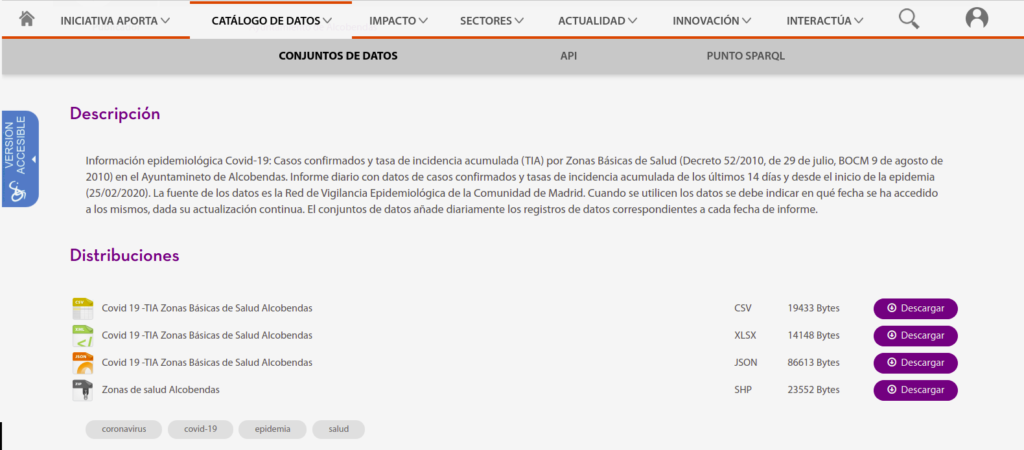
You have, on the one hand, the data in different types of formats, and a shapefile with the geographic data of each referenced area. You can work with any format you want; say you decide to use CSV format the make the ingest. The CSV file looks like this:
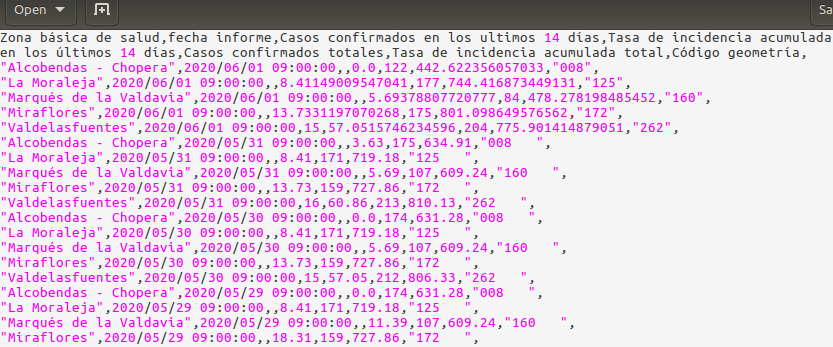
The first line of the file contains the names of each field, separated by commas. With this, you have everything necessary for the definition of your Ontology.
You will use the tool of the Ontology Creation Platform, Creation step by step, and will select the Empty Base option, once you have filled in the Ontology’s metadata.
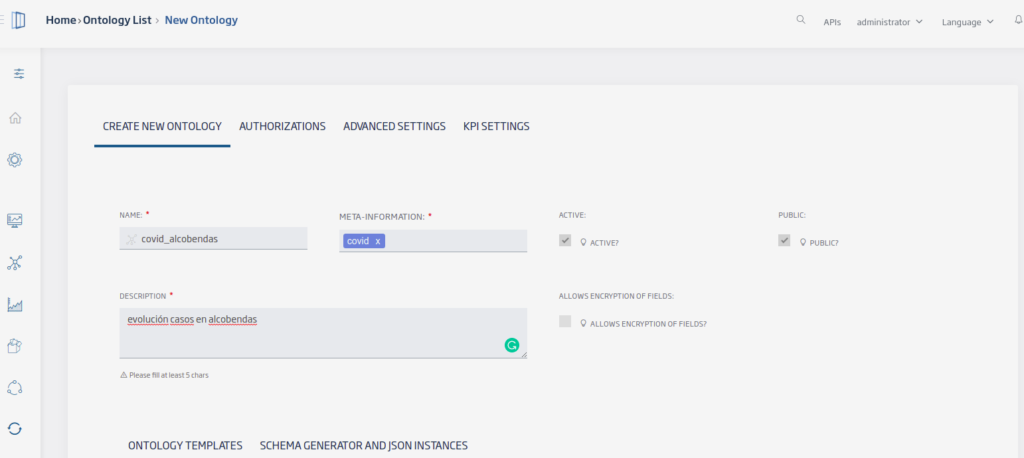
Define the field names and their corresponding data types:
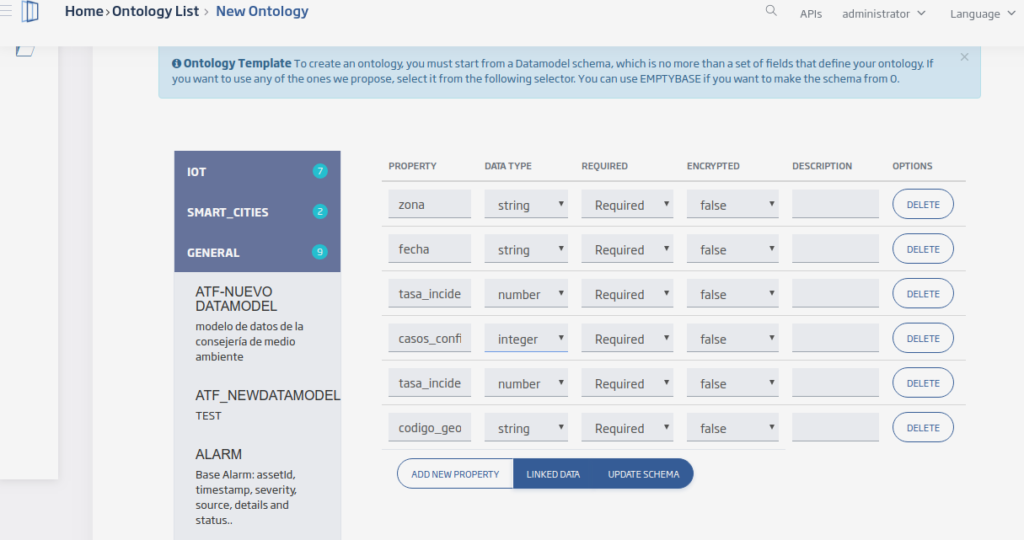
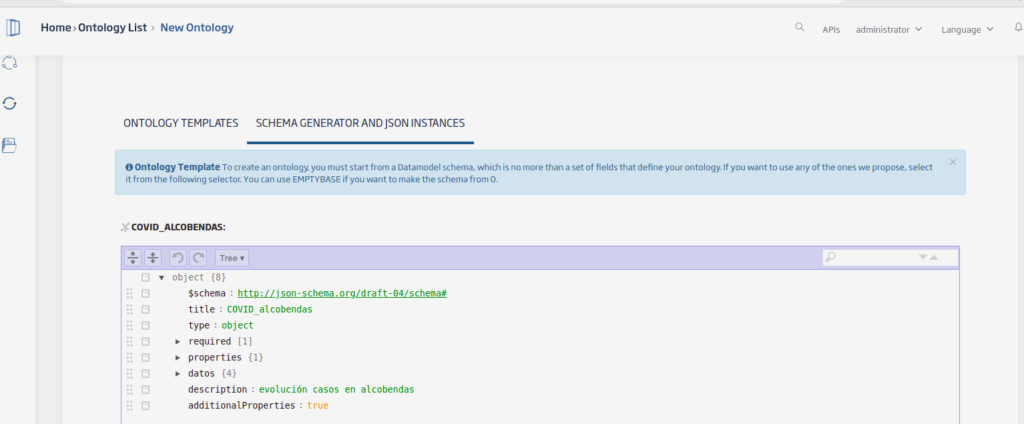
Then, click on the Update Schema option to view the generated scheme. If you click on the Generate Instance option, you can see an example instance.
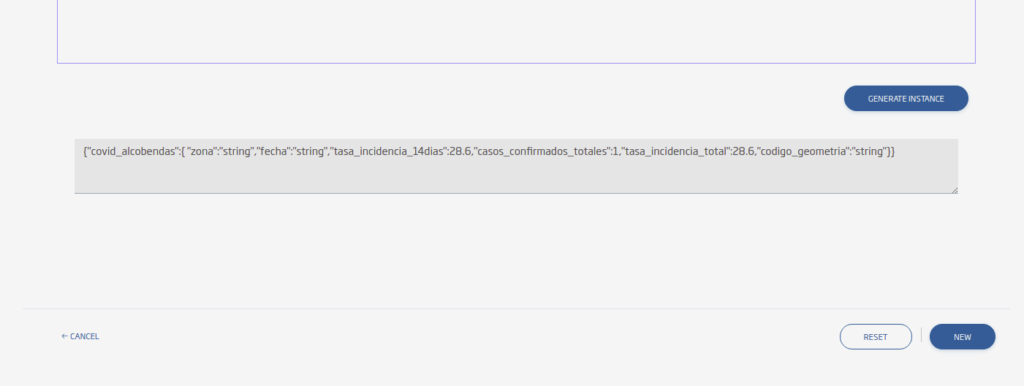
After clicking on NEW, you will have your Ontology, created and ready to be used in your ingest flows.
Ingest flow
Next, you will perform the intake flow to make the public data available on the Platform, with the format that was defined in the previous point. The flow is as follows:
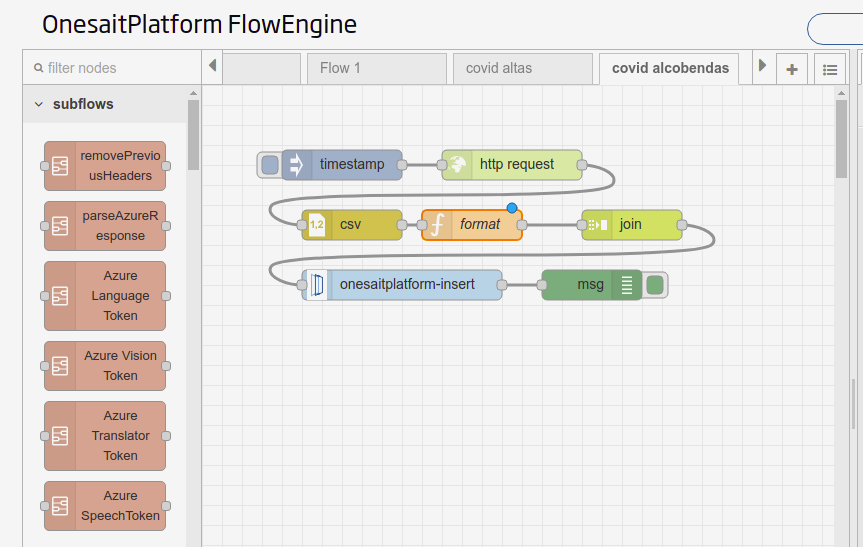
- Timestamp: injects a message into the flow to force its execution.
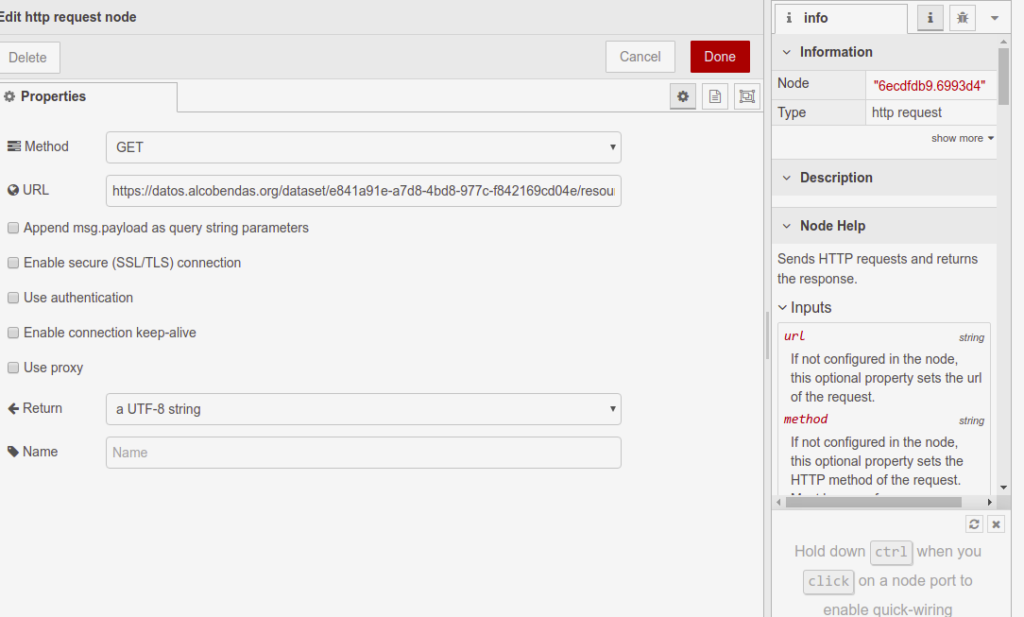
- HTTP Request: specifies the URL to attack: https://datos.alcobendas.org/dataset/e841a91e-a7d8-4bd8-977c-f842169cd04e/resource/be4732de-a69a-48c2-849a-be8130a9f64f/download/recurso.csv
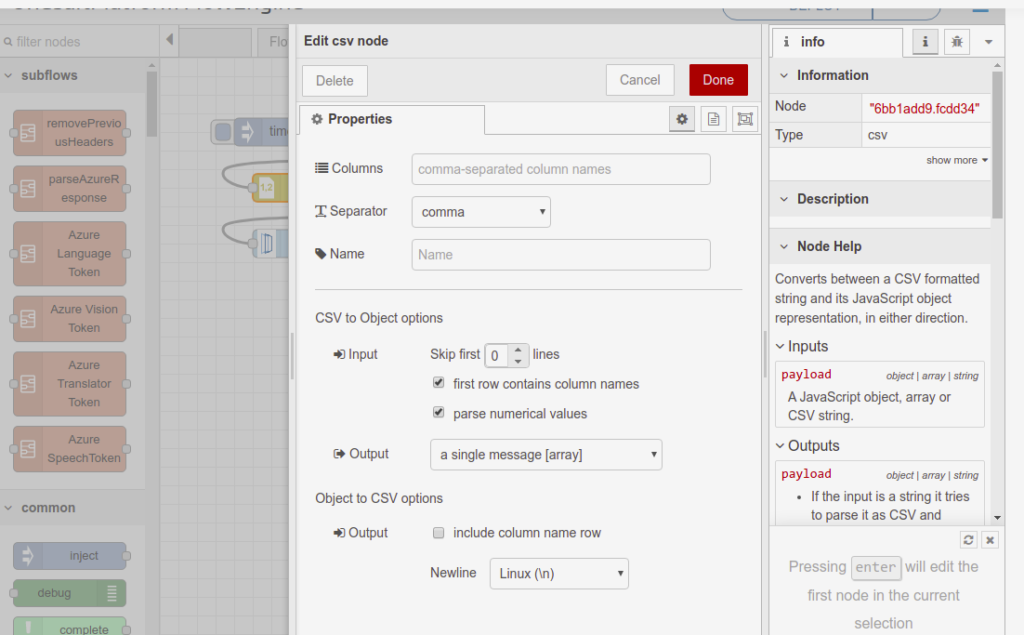
- CSV: transforms the message into CSV format, an array of objects for further processing. Indicate the comma field separator (,), activate the check to process the first line as field names, then specify that you want a message with an array with all the data as the output.
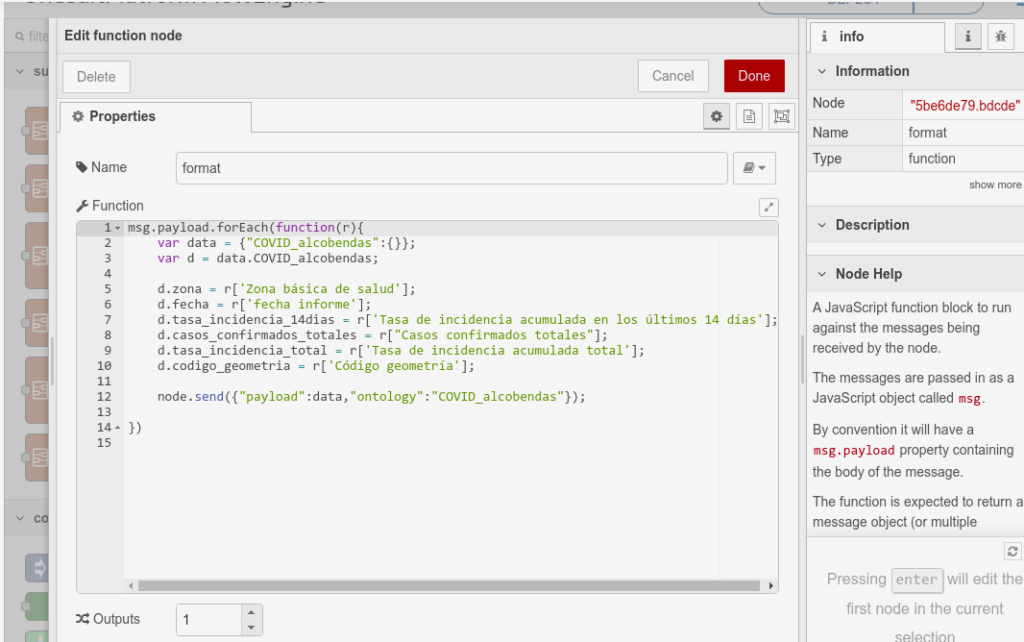
- Function: here you give the format to each data record according to the Ontology scheme defined in the first point.
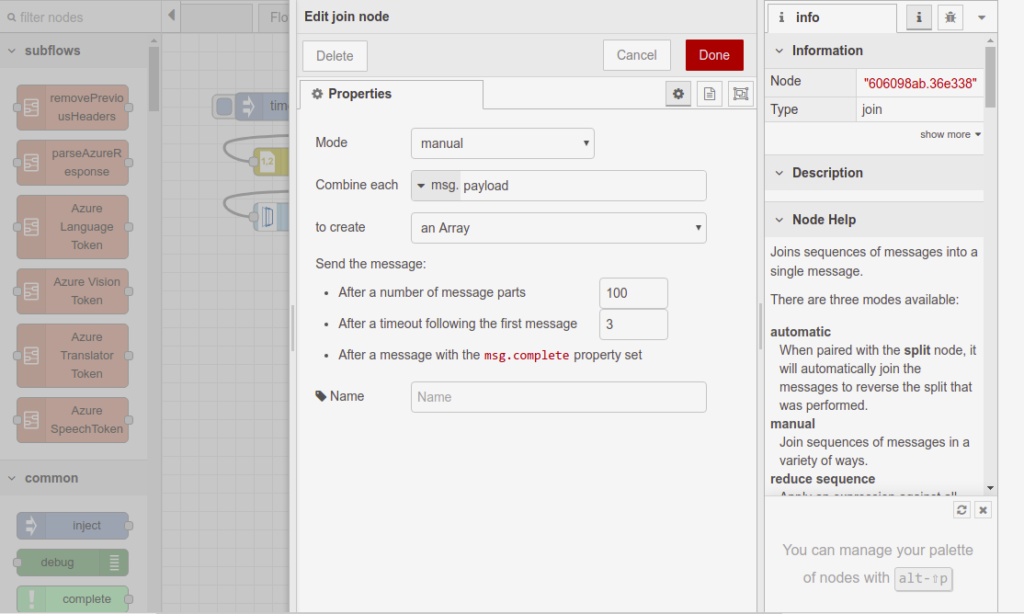
- Join: this box is to group records, so that you can perform bulk operations instead of persisting each record individually. You must specify the field of the message we want to group (payload), the destination format (array), and the limit of records that can be added, or a timeout in case the upper limit is not reached.
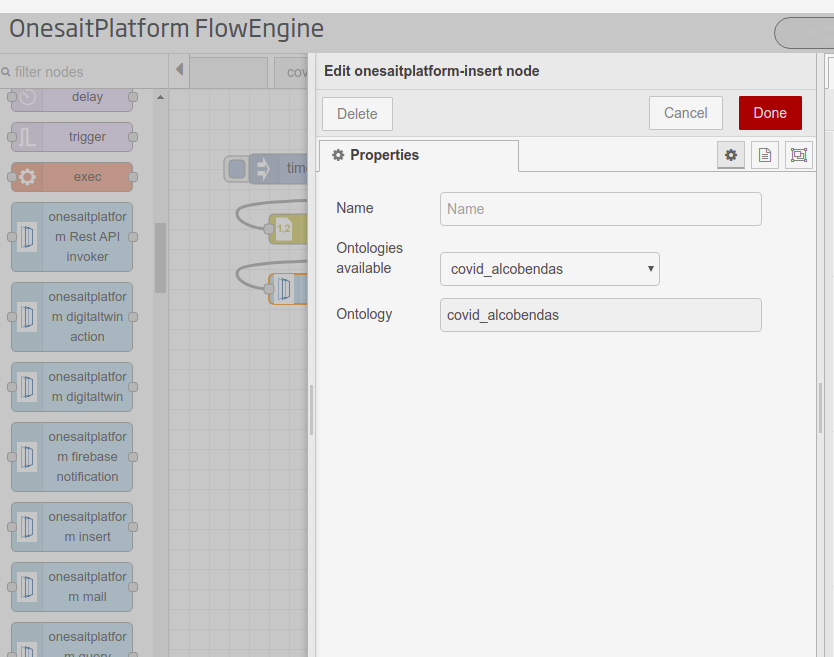
- onesaitplatform-insert: used to ingest data into a Platform Ontology. The target Ontology must be specified.
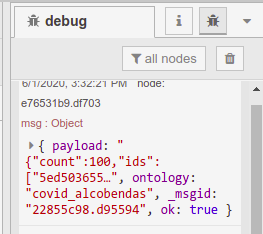
Now you just have to run the flow to persist the records in the database. Once you run it, the result of the insertion operation will appear in the debug tab. As you can see, the records of a count of 100, which is our upper limit of grouping, have been persisted.
Dataset and resource creation in CKAN
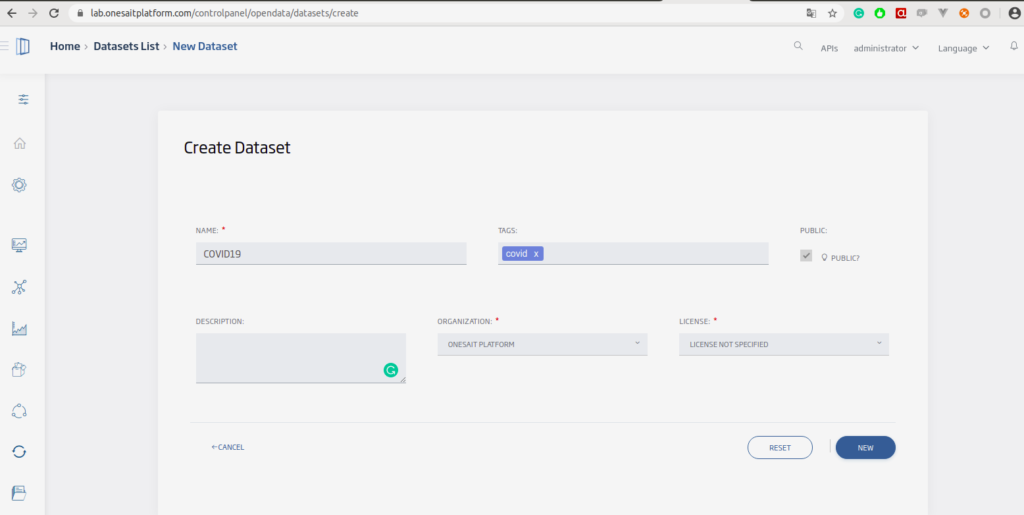
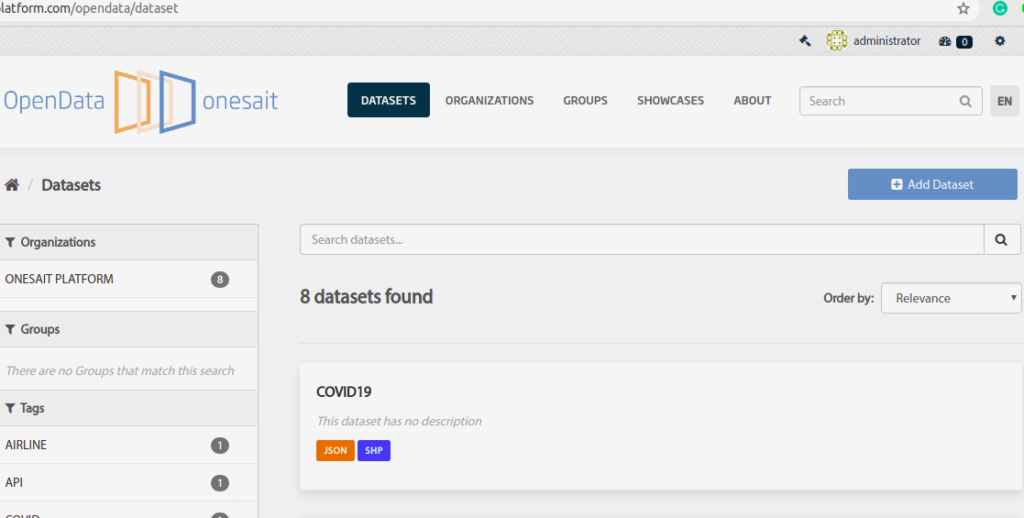
Finally, to visualize the data in the portal, you must create the corresponding resource in CKAN. If you don’t have a dataset to save the resource there, then you have to create it:
Now you can create your resource and assign it to the newly created Dataset.
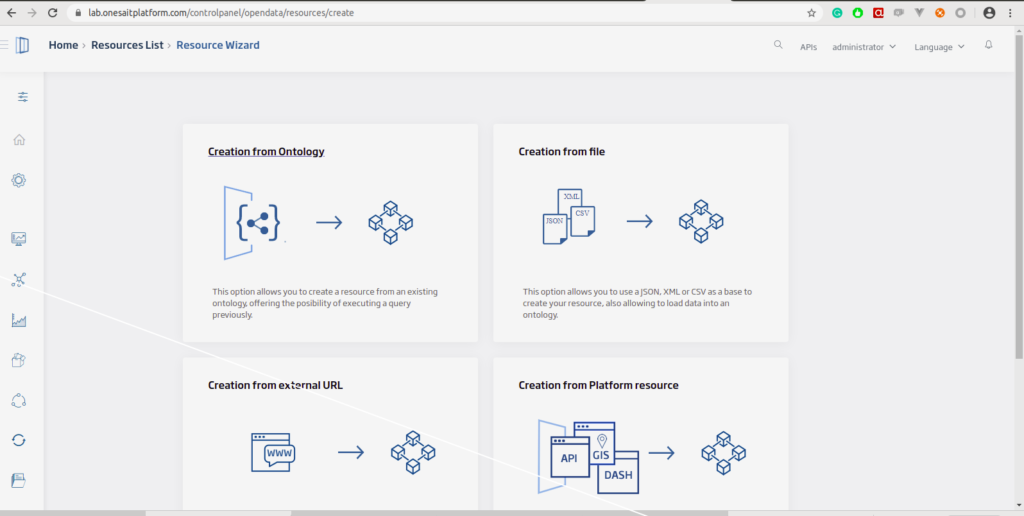
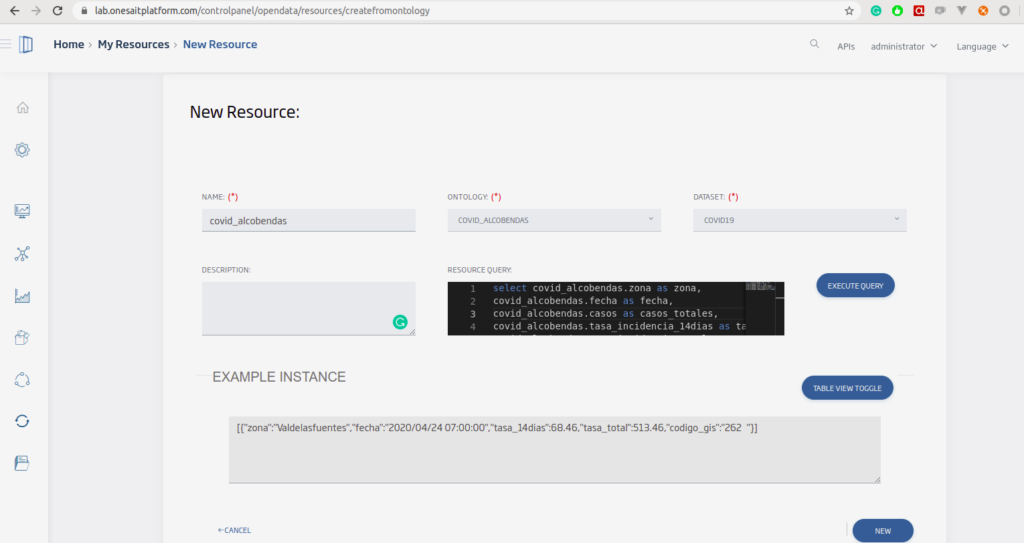
In the creation screen, define the resource name, the dataset it belongs to, the source Ontology and the query to be made.
Una vez se hayaOnce the resource has been uploaded to CKAN, you will have the data available in your portal.
Data visualization and creation of views
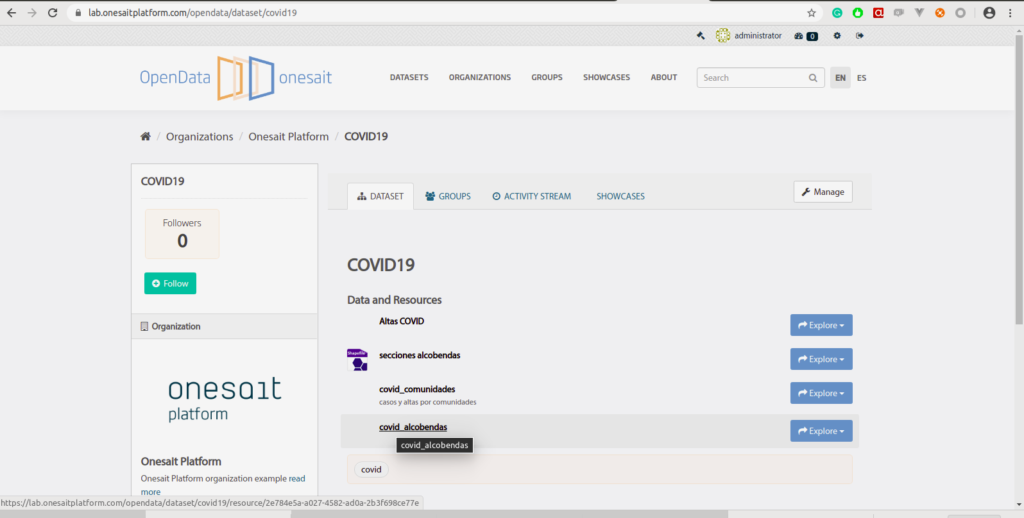
When accessing the portal (/opendata), you can see the Dataset you have created, along with its resources:
And now you can use the CKAN datastore to query and filter data in real time.
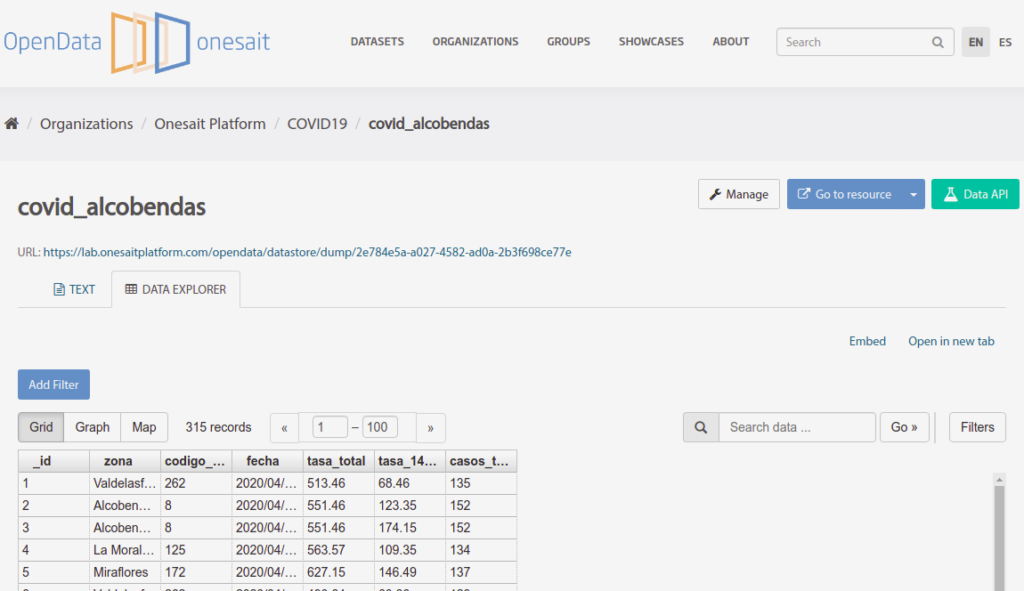
You can also define new views for the data representation.
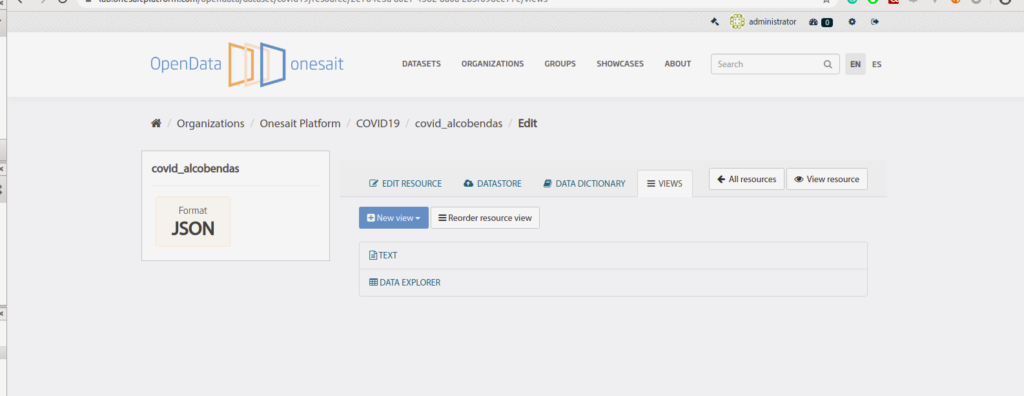
Let’s create a graphic type view as an example. To do this, go to New View > Chart Builder.
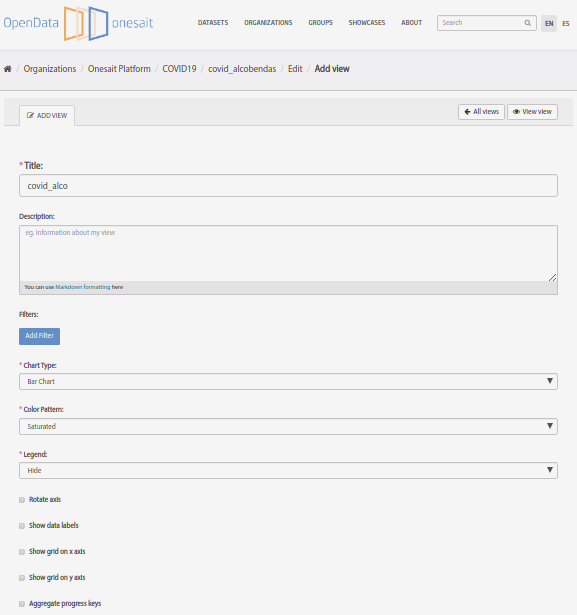
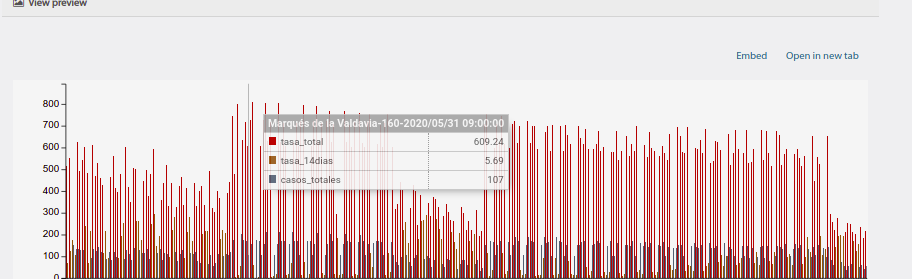
Select as data keys: the total rate, the rate in the last 14 days and the total cases, which you will represent with its corresponding area, GIS code and date.
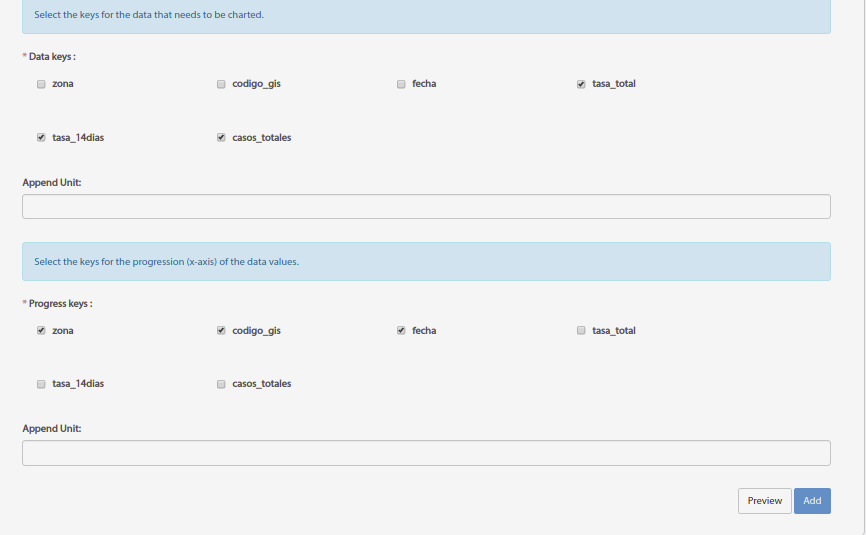
Click on Preview to visualize the graph’s rendering:
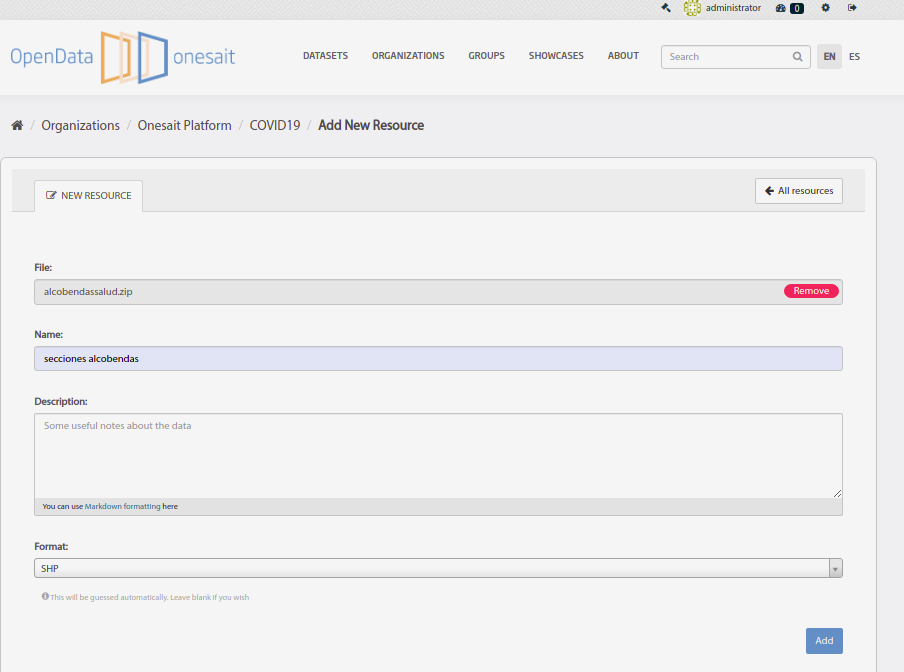
Finally, add the shapefile for the view of the different areas of the district within the same Dataset.
The creation of this kind of resources is not integrated in Onesait Platform yet, but you can add it as an external resource in the same CKAN. To do this, you only have to create the corresponding resource (SHP format).
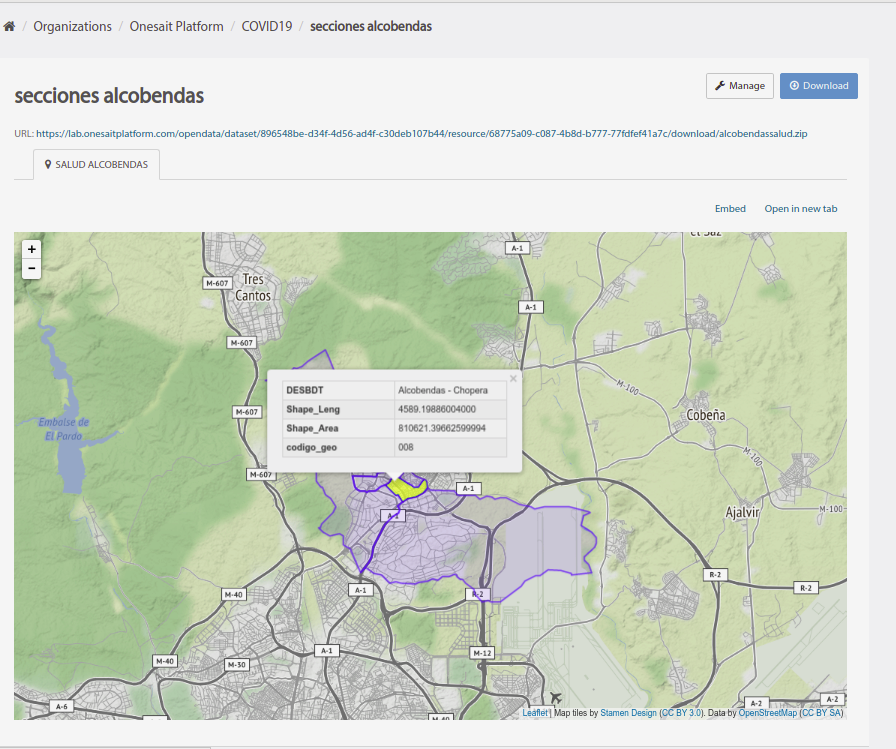
Once it has been uploaded to the datastore, you can visualize it with the shapefile plugin.
As you have seen, the integration of external data in our Open Data isn’t hard. Services have also been provided for the creation of resources from files, as well as platform resources (GIS, Dashboards, etc). This makes Onesait Platform’s CKAN a very powerful tool for the integration and visualization of open data.
We hope you enjoyed it! And if you have any question, leave us a comment.