
Onesait Platform online training course (part II)
After the first part of the Onesait Platform online training course, by José Luis Jarabo, it is now time to deepen in the content of these activities. To do so, we will go over each of the modules, explaining what was discussed.
1.- Introduction
Considering the range of profiles that signed up for the training, we began by putting the participants into context about the Onesait Platform. Our goal was to collect both the multidisciplinary nature of the Platform to be used in different sectors, and its capabilities, distributions and business value.
During this module, participants were taught to create a profile on the Onesait Platform, requesting a change of role in the process, so they could later start working with all the tools available to the user of Analytics user.
2.- Onesait Platform Functionalities
We started to get down to business, after a short description of Onesait Platform’s three flavors: Engine, Intelligence and Edge; then we analyzed the reasons to choose each and its interoperability. After that, we first entered in the Platform’s Control Panel, browsed through each of the possibilities and displayed the Open Source technology that inhabits behind each one.
The concept of ontology and its integration into the horizontal semantic layer of all the tools was particularly appealing to the attendees. We finished the general overview with several use examples, along with data flow designs to strengthen the image of how the different parts are related to each other. The time assigned to this module was the most discussed aspect.
3.- Ontologies
The Onesait Platform is based on a Data Centric architecture, where ontologies are the core. The ontology represents the data model within the Platform, and constitutes a table in the simplest case or a set of tables in a complete domain model. It is represented as a JSON-Schema, which defines the structure of the information to be stored.
During the module, we explained the reasons explained the reasons why the use of ontologies makes sense. For example, the templates offered by the Onesait Platform to follow recommendations or standards, storage independence, the query engine that allows executing queries in SQL or in native languages, the possibility to APIfy ontologies, the visual representation through Dashboards, the IA capabilities on the Platform through a Notebook Hub, etc.
We also reviewed the CRUD operations (Create, Read, Update, Delete) and exposed the different methods to create ontologies. Finally, we presented two practical cases; the first one consisted in the creation of an ontology from scratch, step by step, and the second one, doing so through an XML file.
4.- DataFlow
First, our colleague Natalia explained what DataFlow is and its origin – StreamSets. Then, we moved on to how the tool works within the Platform and how to create and access the flows.
We then went through the types of stages and the most used connectors, both sources, processors and destinations, along with their respective configurations.
We also showed the alert types and the examples of activation and definition of these within the flow. We also explained the flow monitoring: the available metrics and how to visualize them.
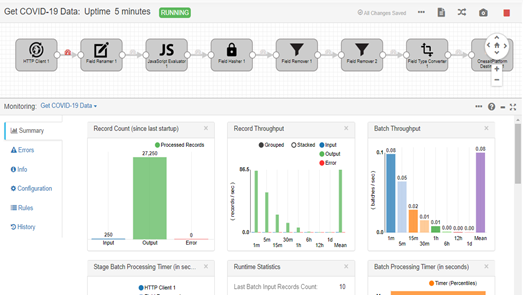
To finish the training, we spent some time creating a DataFlow that extracted the data, in real-time, from an API on the COVID-19. This flow processed and transformed the data a couple of times to adapt them to the target ontology we gad created, to finally insert them into the ontology.
5.- FlowEngine
Since the audience was unfamiliar Node-RED -the tool on which FlowEngine is based- we carried out an introduction on its basic concepts, advantages and a suitability analysis according to the type of project.
We then started the practical workshop: create a domain, explain the different options of the work window, and create a first flow. In less than 10 minutes, the students got their first “Hello world” in the debug window. We browsed through other input and output options, then started a real use case.
It took only forty-five minutes for everyone to send the tilt data via MQTT from their own smartphones’ accelerometers, and record that in an ontology. Then, half an hour more to know how to extract data from it and generate a service in API REST, from which to know this information from all the course attendees’ phones. From zero to IoT in one hour and a half.
6.- Notebooks
Although some attendees were relatively familiar with different Jupyter-type notebooks, we started the session with a basic review of their usefulness to exploit, visualize and create ad-hoc algorithms. Since previous sessions had worked with ontologies, we specified that this data would always be available to access them through the Platform Notebooks.
To add more context to the usefulness of the tool, we explained which are the possibilities of creating micro-services and to APIfy the Notebook itself to make it accessible both inside and outside the Platform.
After getting a general context of this tool’s usefulness, we went deeper into the software engine of the tool, Apache Zeppelin. The goal was to understand that the potential of Notebooks on the Onesait Platform is based on a platform where almost any programming language can be used.
Thanks to Apache Zeppelin, you can create objects and put them in a pool for later access. This access can be done using any analytical language such as SQL, R, Python or Scala. During the session, we also showed a practical and simple example to understand the operation of Apache Zeppelin.
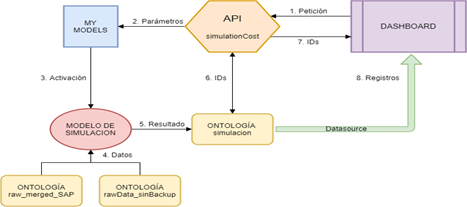
Finally, to conclude the session, we presented a real case, developed for a cement producing client, where all the analytical transformation for the calculation, projection and daily simulation of costs is done with the Onesait Platform Notebooks. The session ended with a series of interesting questions about how the Notebooks fit in the data flow, and about the available options to debug them.
7.- APIs and Tokens
This component allows to take REST interfaces on all the elements managed by the Platform and make them available in a visual way and without programming. Throughout the module, we saw how to create and manage APIs from the Platform’s own Control Panel, and we learned how to access the Swagger Interface to test and invoke our APIs to check their operation.
Finally, we reviewed the services that the Platform includes for the different modules, which allow us, e.g., to run Notebooks or create Ontologies.
8.- SQL
We started the session by specifying the SQL used by the Platform, Quasar SQL2, and in which modules it applies. We pointed out that SQL could be used even if the installed database engine was different, and we showed the advantages and disadvantages of using SQL against the database’s native language.
Since most of the attendees were very experienced in using SQL in relational databases, this session did not explain the basic syntax, instead focusing on the differences, both in commands and some other details, between SQL2 and the one Oracle uses.
9.- MongoDB
On the third day, we started explaining MongoDB, which is one of the databases on which the Onesait Platform can be deployed.
We went over the features of the documentary databases and why they can be useful to our projects. We then described the most basic queries that Mongo allows us to do, and finished with examples of more complex queries using the aggregation framework.
10.- Datasources and Gadgets
The Datasources section was among the shortest, since the students came with experience from the previous SQL and MongoDB sessions, which is where you really learn how to perform queries on the Platform’s ontologies.
We therefore reviewed the queries’ basis, and how Datasources are a great tool to connect the more Data Analytics part with a visual dashboard for the user. We described this dashboard in the next lesson of the training. Along with the live explanation, the students were able to set up their own Datasources that they would later use in their example Dashboards
11.- Dashboard Design
This section may well be one of the most visually appealing, as it is where we begin to see the analytical results that go into the whole previous data collection process.
First, the students created their own Dashboards and examined all the pieces that make it up: header, canvas, Dashboard Configuration tab, etc. Then, they went down to it with the different types of predefined Gadgets included: bar, line and pie charts, tables, etc.
We made special emphasis in filtering between different Gadgets since it is surely one of the main qualities that Dashboards have within the visualization capabilities.
We then proceeded with a somewhat more advanced example to carry out the integration of a chart from an external library, within the Platform. Likewise, the students included the Datasources that they had previously created in the Dashboards, to connect their queries to the ontologies and represent them visually in the dashboard, thus closing the circle that they had started a few hours before.
12.- My Files, Web Projects and My Projects
These three tools, easy to use but no less useful notwithstanding, allow users to share documents on the Onesait Platform and give other users permissions to edit or view their work.
Specifically, My Files or Web Projects tools are the ones that make it possible to share documents in different formats (PNG, JPEG, PDF, CVS, XML, HTML, etc.) from the Onesait Platform, and My Projects is used to share a user’s work with other people on the Platform.
During the course, we paid more attention to the latter since the doubt arose among the participants about how to give permissions to Platform clients on the work they have done, .
13.- Reports with JasperReports
One of the tools appearing in the Barbarian version, launched in the first quarter of 2019, was the integration of the JasperReports library into the Onesait Platform for execution of automatic reports from the Platform.
To use it, you need to create a .jrxml file containing the code that will later be executed from the Onesait Platform. Because of this, during the module, besides presenting the tool and introducing the JasperReports library, we showed the participants how to design reports from an IDE (Integrated Development Environment), specifically Jaspersoft® Studio, then upload those to the Onesait Platform and execute them from there. The achieved result is shown below:
14.- Development of a complete project on the Onesait Platform
In order to consolidate the knowledge acquired in the different training modules (20 hours), it was considered appropriate to have a final day of training in which an analytical project was carried out, from start to finish.
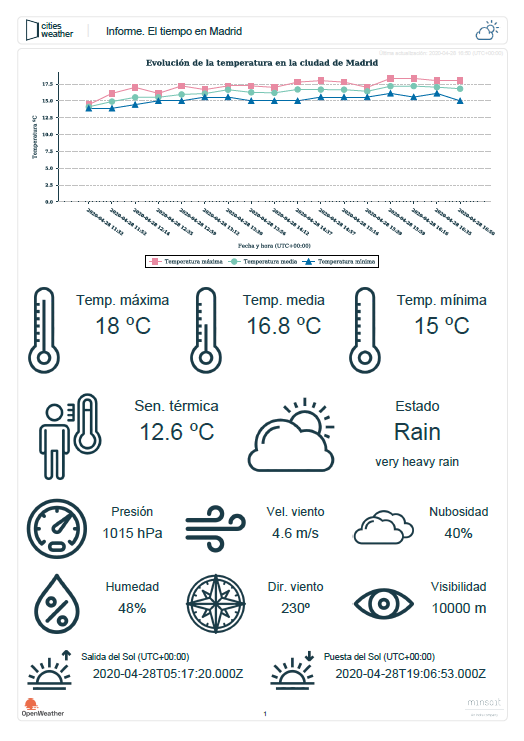
We decided to make a Dashboard with its corresponding report in JasperReports, showing the temperature in Madrid in real time, because we found this was not very difficult. These were the steps that were followed:
- ETL process: the extraction, transformation and loading of data was done in FlowEngine, supported by Node-Red.
- Connection to the OpenWeatherMap API: with Madrid weather data (weather status and description, maximum temperature, minimum temperature, average temperature, apparent temperature, pressure, humidity, wind speed and direction, cloudiness, visibility, sunrise and sunset time).
- Transformation with JavaScript: of the data related to the date and time, as they came in milliseconds.
- Ontology creation: under My Ontologies to be able to load the data transformed into it from FlowEngine.
- Datasource creation: design, in SQL, of the datasource that feeds the line gadget and the other KPIs of the dashboard.
- Gadget creation: from the Gadgets tool, both the line graph that shows the evolution of the temperature in time and the template of the KPIs gadgets are designed.
- Dashboard configuration: design and configuration of the final dashboard that will show all the data, already transformed, that have been recovered from the OpenWeatherMap API. Insertion of the gadgets in the dashboard and their organization inside it.
- API creation: design of the API that will allow the connection between Onesait Platform and JasperReports.
- JasperReports report: configuration of the report that we will be able to execute from My Reports, with the last data loaded in the ontology about the weather in Madrid.
As you can see, it has been a very thorough course, considering the time it has lasted. We hope you have found it interesting, and if you are interested in some kind of training, leave us a comment about it.

Pingback: Training course (part VI): SQL – Onesait Platform Blog
Pingback: Training course (part VIII): Datasources – Onesait Platform Blog
Pingback: Training course (part X): My Files, Web Projects & My Projects – Onesait Platform Blog
Pingback: Training Course (Part XI): JasperReports – Onesait Platform Blog
Pingback: Training course (part I): Ontologies – Onesait Platform Blog
Pingback: Training course (part II): DataFlow – Onesait Platform Blog
Pingback: Training course (part III): FlowEngine – Onesait Platform Blog
Pingback: Training course (part IV): Notebooks – Onesait Platform Blog
Pingback: Training course (part V): APIs & Tokens – Onesait Platform Blog
Pingback: Training course (part VII): Introduction to MongoDB – Onesait Platform Blog
Pingback: Training course (part IX): Dashboards and Gadgets – Onesait Platform Blog