Distributed tracing on Onesait Platform
With the rise of cloud computing, microservices architectures, and increasingly complex business requirements, the need for Observability has never been greater. Observability is the ability to understand the internal state of a system by examining its outputs. In the context of software, this means being able to understand the internal state of a system by examining its telemetry data, including traces, metrics, and logs.
This new functionality in the 5.1.0-Survivor release, allows a request to be traced from the moment it is generated, to its end, which is important in an architecture of this type in which a request can go through several microservices and modules.
For a system to be observable, it must be instrumented – That is to say, the code must emit traces, metrics and records. For this, we use OpenTelemetry. The instrumented data must then be sent to an Observability backend; in our case, to Jaeger.
What does this functionality solves?
- Monitoring of distributed transactions.
- Performance and latency optimization.
- Analysis of the root causes of problems.
- Service dependency analysis.
- Context propagation in distributed environments.
Example application
To clarify how distributed Tracing works, we show next how distributed Tracing would work between two micro services and the API Manager and Semantic Information Broker of the Platform.
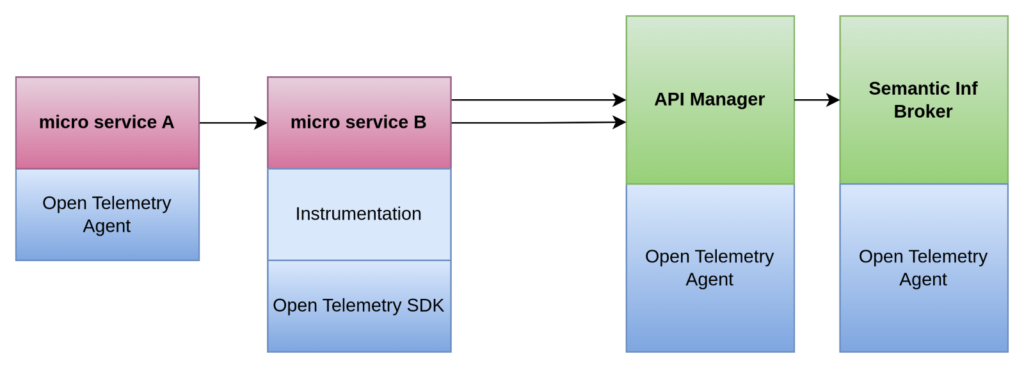
A request is made to micro service A, which in turn makes a request to micro service B.
Micro service B has to make two calls to the Platform’s API Manager to prepare a response; and the Platform also makes requests to the Semantic Information Broker.
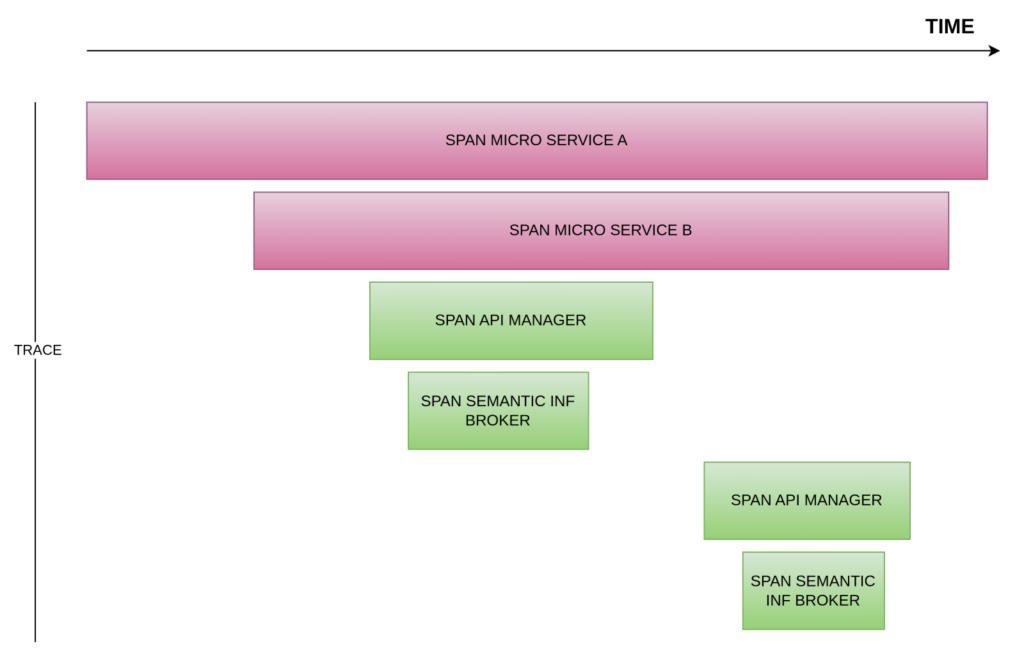
You can see that the trace is the set of spans involved in the entire process over time, and how each span can be identified with the service to which they belong to and in the order in which they have been executed.
How to access the functionality
These traces can be seen from the Control Panel in the TRACING option:
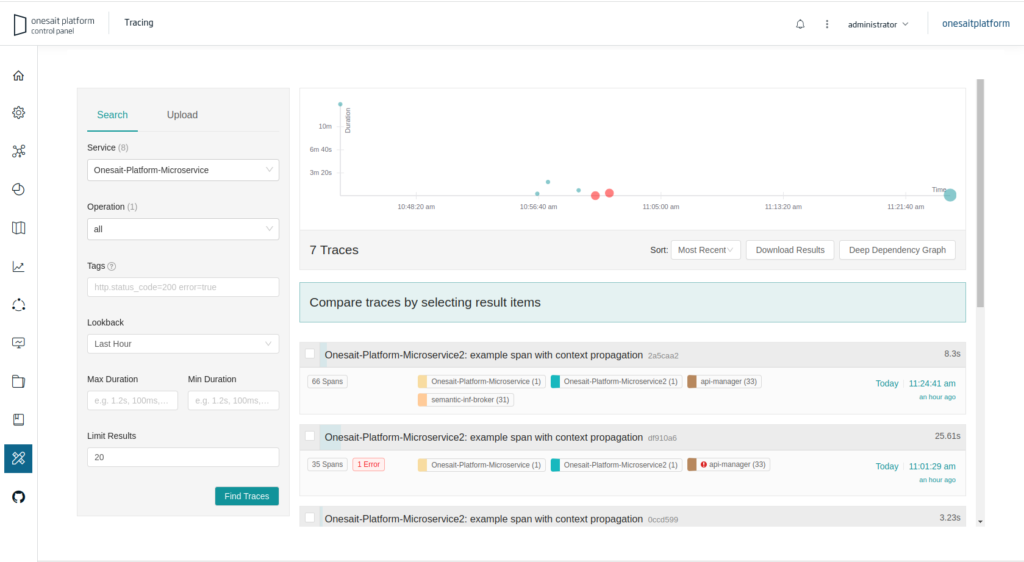
Trace query
For this, you have a trace searcher from the origin servic. You can filter by operation, tags, duration, how long ago you want to go back, and limit of results.
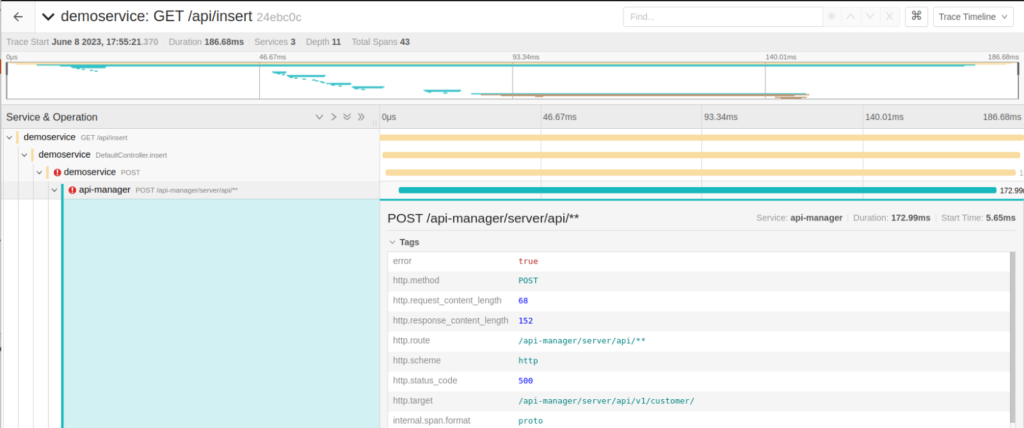
This screenshot shows the traces of the previous case in which we start from the invocation of one micro service to another and from this to the Platform’s REST API. In the traces, you can see how much time has been spent in each span, and more detailed information in key value format, which is useful to detect bottlenecks, interruptions between components, etc.
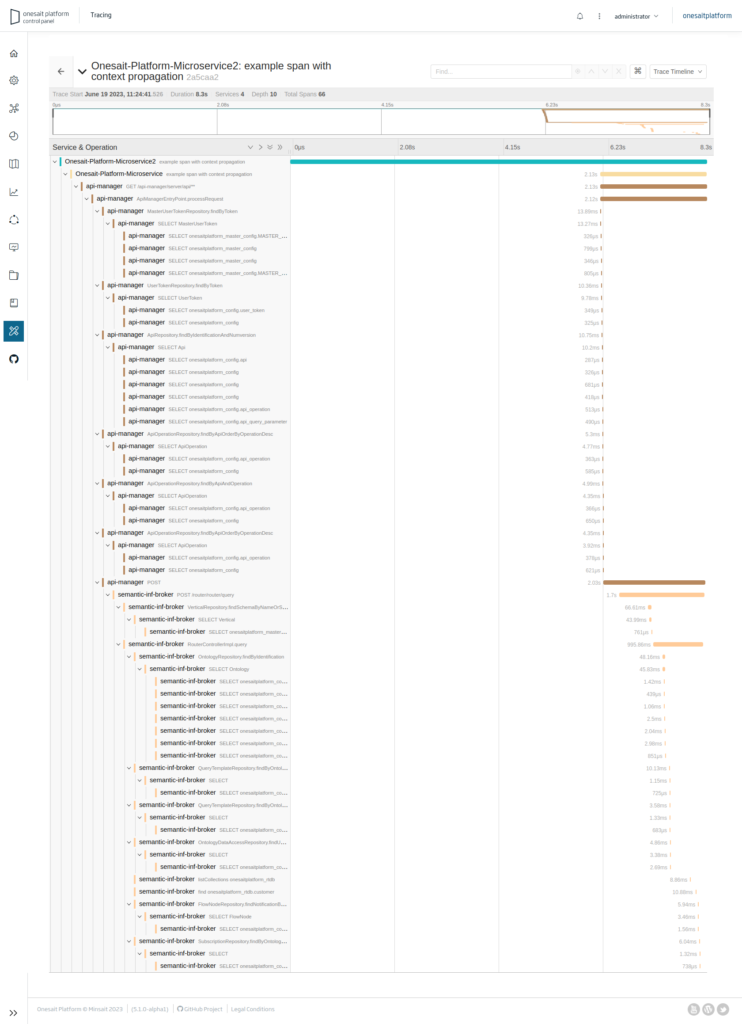
In addition, in the event of an error, the traces themselves indicate it, as in this screenshot: