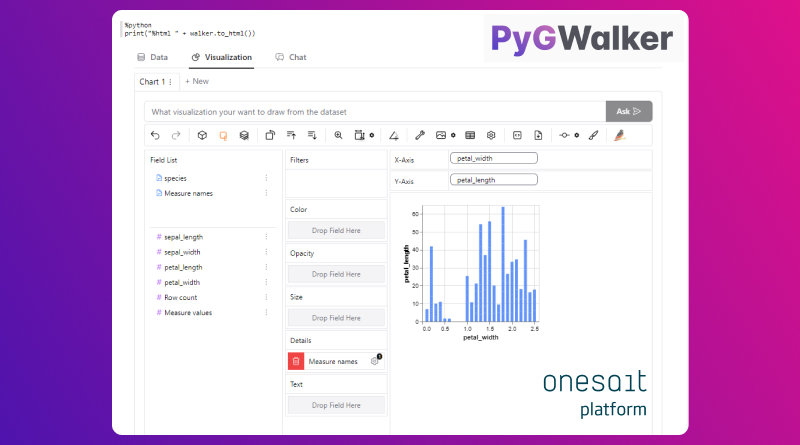
PyGWalker integration in Onesait Platform Notebooks
For this 6.2.0-Xenon release of Onesait Platform we have added PyGWalker to our Notebooks module, a data analysis and visualisation tool for Jupyter that turns Pandas DataFrames into an interactive user interface for visual exploration.
Let’s see what this library is all about.
What is PyGWalker?
PyGWalker (pronounced as ‘Pig Walker’) is short for ‘Python binding of Graphic Walker’. It integrates Jupyter Notebook with Graphic Walker, an open source alternative to Tableau. It allows data scientists to both visualise and cleanse and annotate data with simple drag-and-drop operations, and even perform natural language queries.
The following video explains how it works:
Our goal has been, therefore, to be able to use Pygwalker directly in Onesait Platform, within the Notebooks engine (Zeppelin) we have.
How to use it from Notebooks
Create a new Notebook
From Control Panel, with an ‘administrator’ or ‘analyst’ account, navigate to the Processing > Notebook Management menu.

From the list of Notebooks, create a new one by clicking on the ‘+’ button:

The first thing to do is to indicate the name of the Notebook:

Once this is done, you can proceed to create the Notebook.
Configuring the Notebook
First we will install the PyGWalker library. We will do this in the first paragraph of the Notebook using pip, previously invoking the Zeppelin shell interpreter:
%sh
pip install pygwalker
When the paragraph is executed, the necessary library and dependencies will be installed.

In a second paragraph, we will import the ‘pandas’ and ‘pygwalker’ libraries using the Python interpreter:
%python
import pandas as pd
import pygwalker as pyg
The environment is now set up and ready to work.
Uploading data to the Notebook
As an example, we will use the following CSV file found in a GitHub repository: https://raw.githubusercontent.com/mwaskom/seaborn-data/master/iris.csv
To include it in the Notebook, a new paragraph will be created with the Python interpreter where it will be read as a CSV file:
%python
iris = pd.read_csv('https://raw.githubusercontent.com/mwaskom/seaborn-data/master/iris.csv')
That done, the next step is to instruct PyGWalker to interactively parse and explore the data using graphs from the CSV that has been entered. This will be done using the pyg.walk() function:
%python
walker = pyg.walk(iris)
If you run this paragraph, you will see a huge string of code with alphanumeric content, but nothing really visual.

In order to display it correctly, the result must be printed by invoking the walker.to_html() function, which will generate the data viewer:
%python
print("%html " + walker.to_html())
The result will look like the following:

Complete code
Below is the full code we have used.
%sh
pip install pygwalker
%python
import pandas as pd
import pygwalker as pyg%python
iris = pd.read_csv('https://raw.githubusercontent.com/mwaskom/seaborn-data/master/iris.csv')%python
walker = pyg.walk(iris)%python
print("%html " + walker.to_html())Header Image: Onesait Platform


