
Data with a spatial component on the Onesait Platform (part II): the visualisation
Last week we told you how you can support and store data with a spatial component in the Platform, so in this second entry we will see how you can visualize that data.
Where can we visualize this spatial data? Easy: On a map.
Map viewers
We will represent the data in a map viewer. That is mostlythe software canvas containing the map (either global, provincial, local, etc.) and the georeferenced data.
There are countless types of map viewers in different languages, but in the case of the Platform we use JavaScript-based web viewers, and specifically we use the CesiumJS library.
This library allows you to create maps, both 2D and 3D, worldwide, with good performance, accuracy, visual quality and ease of use. Oh, and it’s also Open Source, so it’s a win-win.
That does not mean that we do not use other libraries such as Leaflet or OpenLayers (even the ArcGIS JavaScript API, if needed) – only that we give the former a more direct support and have generated specific tools to use it.
Generating layers
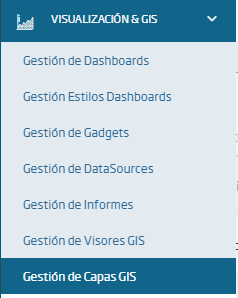
Well, let’s get to it. To be able to visualise our ontologies we first have to generate layers from them. This is as easy as going to Visualization & GIS > GIS Layer Management, then clicking on the «Create» button.
Once you click on it, you will have two options:
- Creation ontology layer.
- Creation external layer.
In our case, we will want to the first option, but if you’d rather use a Web Map Service (WMS) or load a KML, this would be your option.
Once the option is selected, the layer creation wizard will appear. There, you will have to introduce basic information on the layer:
- Identification: here you will specify the name of the layer.
- Ontology: the ontology from which you want to create the layer.
- Public: whether you want it to be accessible to everybody or not.
- Description: a text summarizing the layer.
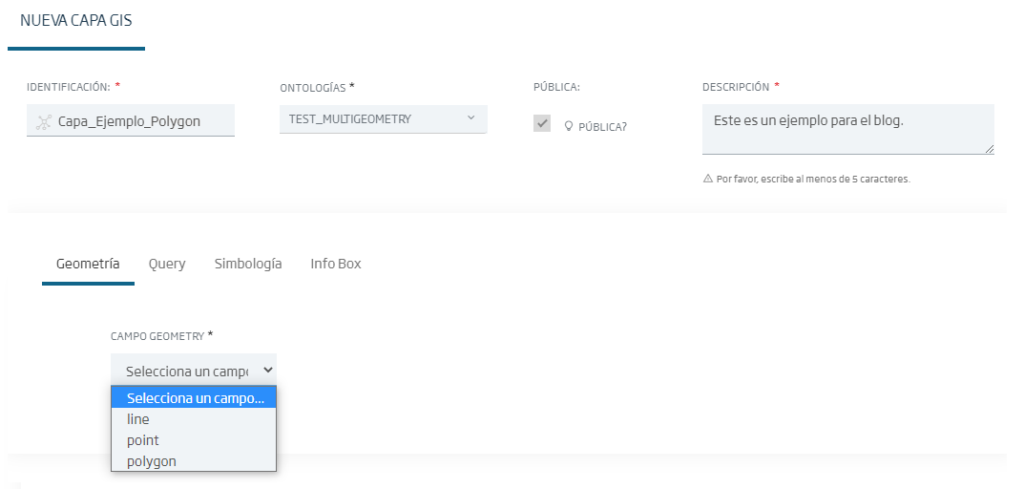
You will have also to select the ontology field with the geometry. If the ontology does not have any «geometry»-type field defined, then no such option will appear and you will not be able to create the layer.
If you have several geometry types, as in my example, you will have to select one of the available options. For this example, I will choose the polygon geometry.
The reason why only one type of geometry can be used is because we use the concept of «entity class», which is defined as homogeneous sets of entities with a common spatial representation.
Other options that can be configured are queries, which allow us to filter the layer’s contents (for example: show me only data with a field value greater than 100), configure its symbology or the information that will appear in the pop-up when you click on each entity («Info Box»).
Creating the map viewer
So you have your little layer. Cool. What’s next? You are going to create a web viewer where you can visualize the generated layer. And, do you know what’s best about this? You won’t have to write any code to get it.
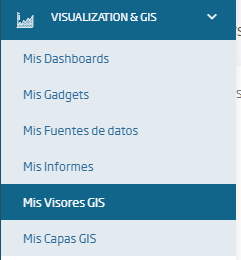
For starters, let’s access the menu Visualization & GIS > GIS Viewer Management.
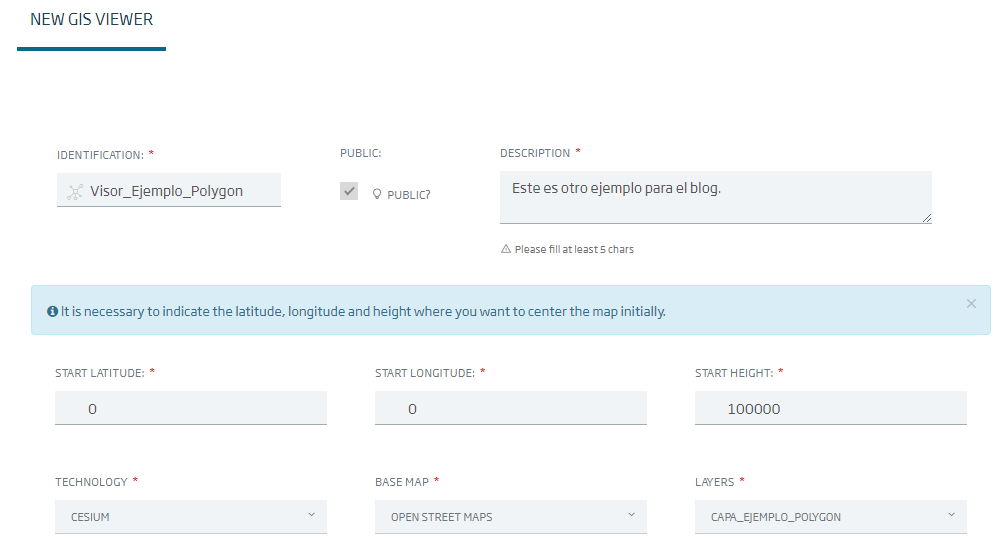
Here, as in the previous case, click on the «Create» button to launch the map viewer creation wizard, where you will enter the necessary information:
- Identification: again, the name that the map viewer will have.
- Public: whether you want it to be accessible to everyone or not.
- Description: a text summarising the map viewer.
- Initial longitude and latitude: in these two fields, you will have to specify the coordinates where you want the map to focus initially. For this example we will point to the coordinates 0.0 (where the «Null Island» is said to be).
- Initial altitude: the initial altitude of the camera, in metres. Just among us, this would be like the camera’s zoom (only here we use meters instead of levels).
- Technology: the technology of the viewfinder to be used. At the moment you can only select Cesium… for now.
- Base map: the background layer of the map (satellite image, street map, etc.)
- Layers: here you can choose the layers you want to add to your map. This is a multi-select combobox, so you can have several of them.
OK: once you have all this configured, the viewer will be ready and working:
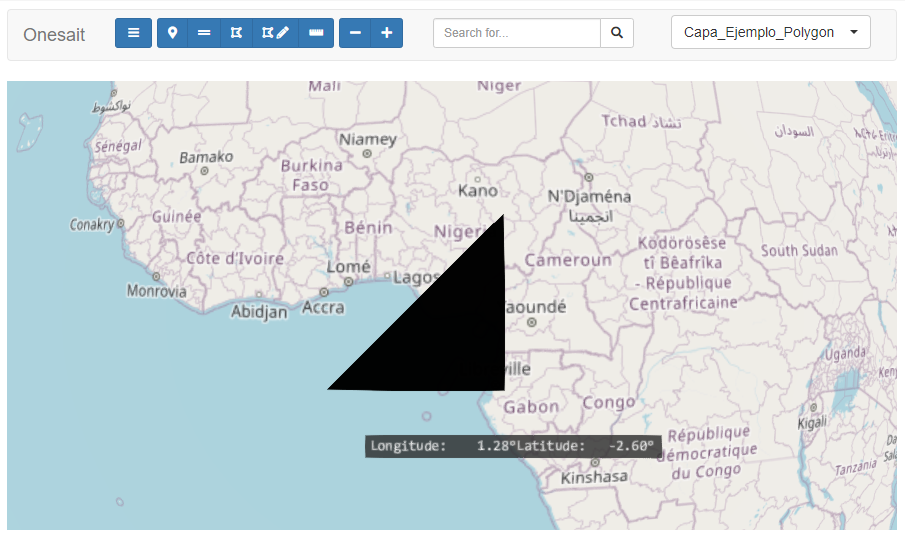
You are probably noticing the code window to the left of the map. What you see is the viewer’s source code:
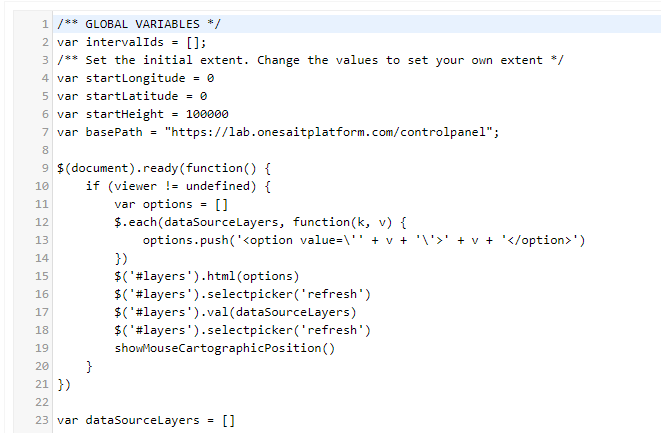
This means that everything you modify here will be reflected in the viewer. Cool, huh? Thus, by using this template viewer, you can visualize your data and also develop functionalities that you think will be useful to you.
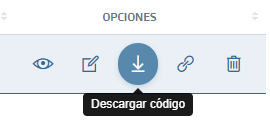
This viewer can be viewed from the Platform, either from the map viewer itself or by embedding it in a Dashboard, making use of the viewer’s URL. Another option you have is to download all the code to have it locally or to use it in your projects.
Downloading is as easy as accessing the list of map viewers and clicking on the download button.
Well, that’s it. In these two articles, we have explained how to prepare data with a spatial component for its later display.
This isn’t something very difficult to do, but if you have any doubt or issue, leave us a comment.


Pingback: Map viewers (Part I): Main Open Source libraries – Onesait Platform Blog