Workshop on the Platform. Part IV: Dashboard
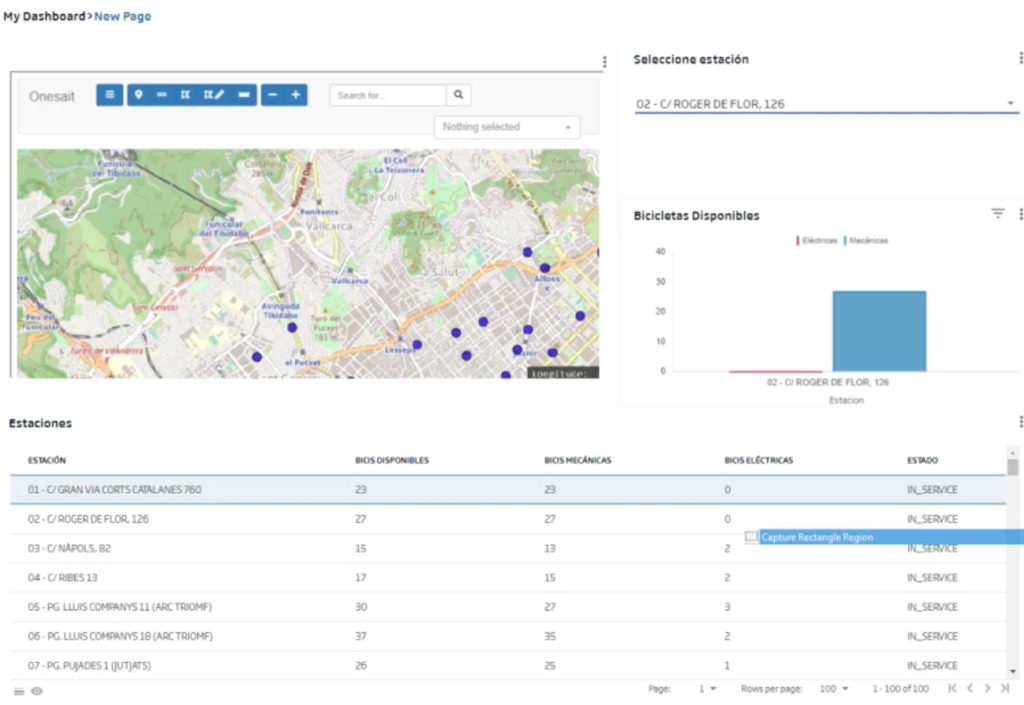
Going on with the workshop on the Platform, this article will focus on creating a Dashboard that will consume the information of the previous ontologies, integrate a GIS viewer with the inventory of stations, show a table with the status of the stations and allow the user to select a station to make a comparison between the number of available mechanical and electric bicycles.
The dashboard’s final aspect will be similar to this one:
The first step is to create the Dashboard, and to do it you must select the menu option Visualizations & GIS > My Dashboards and click on «Create». In the following screen, a form will appear where you only need to assign an identifier and a description.
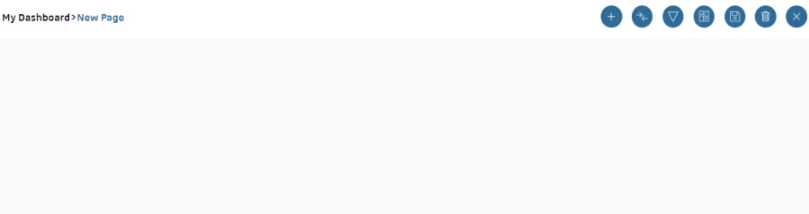
When creating the Dashboard, an editor with a blank grid will open to start adding components:
Include a Gadget with GIS viewer
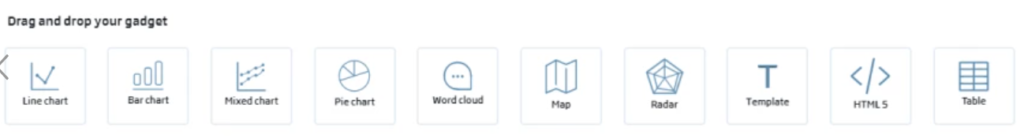
The first Gadget you will include will be a GIS viewer with the inventory of stations. To do it, press the![]() button, that allows you to add elements to the Dashboard grid. With this, an assistant that allows adding Gadgets to the Dashboard will be displayed in the lower part of the screen:
button, that allows you to add elements to the Dashboard grid. With this, an assistant that allows adding Gadgets to the Dashboard will be displayed in the lower part of the screen:
As you can see, there is already a map component, so drag this component to the grid. Next, a pop-up will open to ask whether you want to include an already existing (previously created) Gadget or to create a new one. Choose New Gadget.
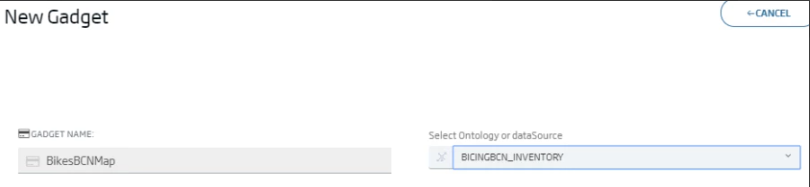
In the following form, assign an identifier to the Gadget and select the ontology where the geographic information to be shown:
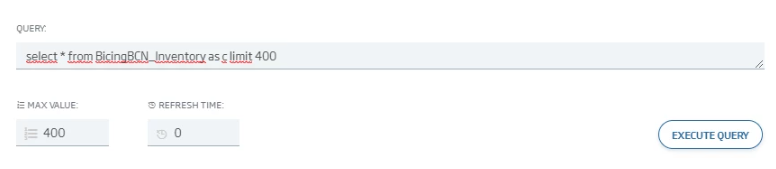
Having done this, you can build a query type sentence that tells the Gadget which sentence it has to launch to retrieve the information to be displayed on the map. In this case, use the following one: «select * from BicingBCN_Inventory as c limit 400»:
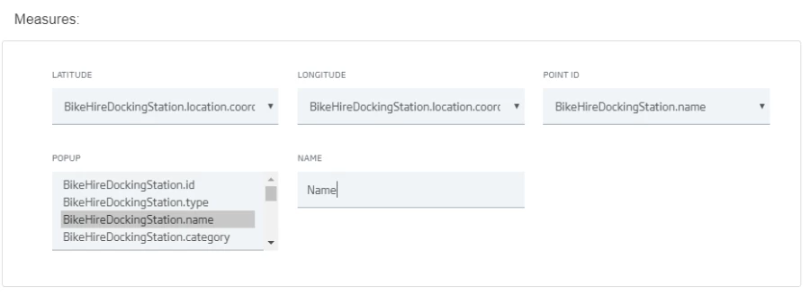
By clicking on «Continue», you will go to the next screen, where you can associate the fields recovered from the previous sentence to their representation in the viewer. Specifically, indicate the field that provides the latitude and longitude, the identifier of each instance, and the properties that will be shown in each element’s pop-up:
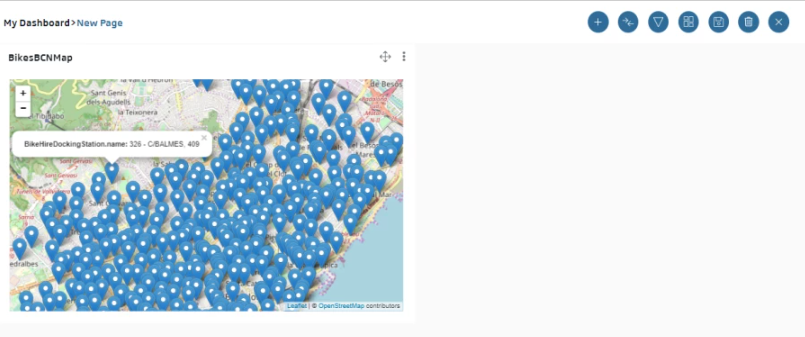
Clicking on «New», you will finish the creation of the Gadget and you can see it on the Dashboard grid:
Include a Gadget with a table with the status of each station
For this Gadget, you will to cross, using a simple SQL JOIN, information from the ontologies BicingBCN_Status and BicingBCN_Inventory, because the ontology BicingBCN_Status does not have the name of the stations.
Besides, this gadget will be periodically refreshed, to reflect the status changes. Remember that the flow that updates the BicingBCN_Status ontology is refreshed every 15 minutes. In order to do all this, you need to create, before the creation of the gadget, a datasource that provides the information and its refresh to the gadget.
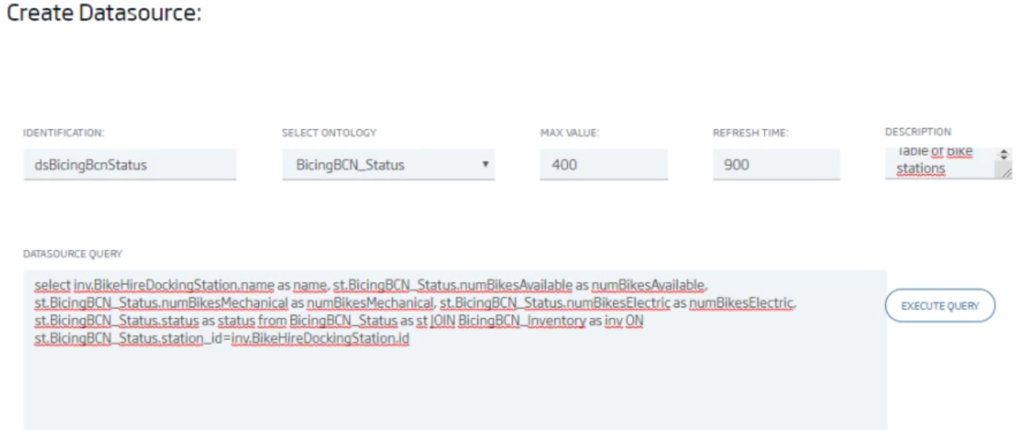
To create the Table Gadget’s Datasource, access to Visualizations & GIS > My Datasources in the platform menu and press the button «Create».
Then, assign an identifier to the Datasource, select an ontology, give it a 15-minute refresh time and associate the SQL statement that provides the information of the two tables:
select inv.BikeHireDockingStation.name as name, st.BicingBCN_Status.numBikesAvailable as numBikesAvailable, st.BicingBCN_Status.numBikesMechanical as numBikesMechanical, st.BicingBCN_Status.numBikesElectric as numBikesElectric, st.BicingBCN_Status.status as status from BicingBCN_Status as st JOIN BicingBCN_Inventory as inv ON st.BicingBCN_Status.station_id=inv.BikeHireDockingStation.id
Once the Datasource is created, go back to the Dashboard editor and add a new Table-type Gadget, and again select «New Gadget» in the popup that appears.
Associate an identifier to the Gadget and select the previously-created Datasource («dsBicingBcnStatus»).
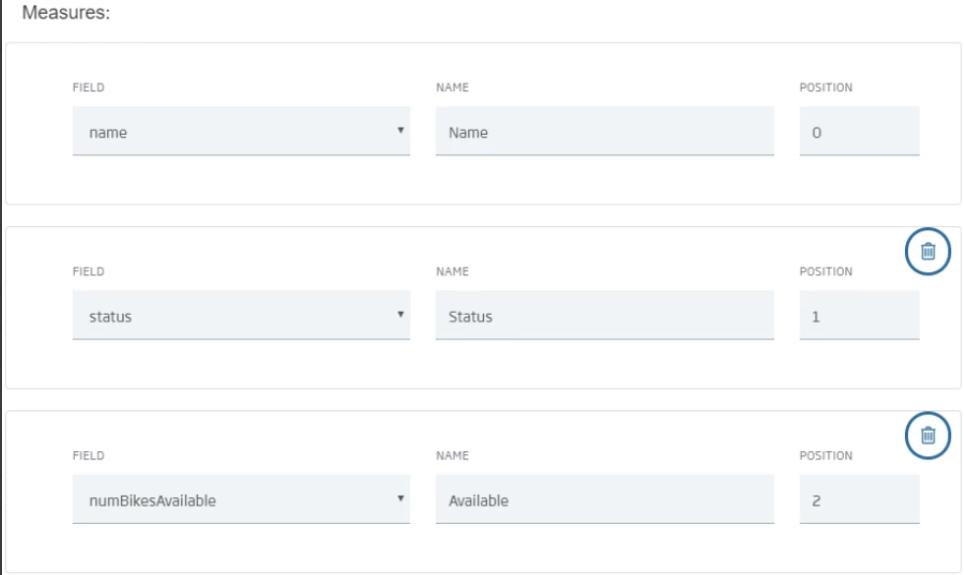
Now, go down to the «measures» section and add the fields to be displayed in the table, which correspond to those indicated in the SQL statement and which you can map to titles for the table columns. You will see dynamically see how they are added to the table:
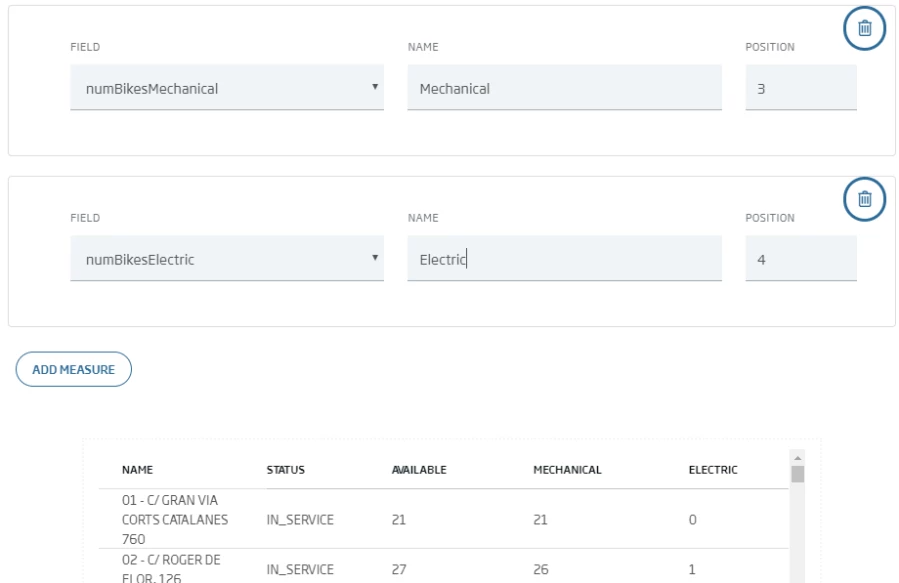
Finally, press «New» to create the gadget and you will see it on the Dashboard’s grid.
Include Station Selection Combo
Next, you will add a selector that will allow the user to select a station. Looking at the gadgets, you can see that there is no combo type gadget, but this can be added as a «Template» type gadget, which is a special type of gadget that allows you to create reusable templates from HTML code.
For this Gadget, first create the Datasource following the same steps as in the previous case. In this case, you need the name of each station, which you will recover from the ontology BicingBCN_Inventory, so this is the query you will use:
select b.BikeHireDockingStation.id as id, b.BikeHireDockingStation.name as name from BicingBCN_Inventory as bOnce the Datasource is created, go back to the Dashboard editor and add a new Template type Gadget, and in the popup select «No» to indicate that you are going to create a new Template type Gadget, so an empty Gadget will be created. Proceed to edit it by selecting «Edit»:
In the following screen, indicate the previously-created Datasource («dsBicingBcnStations»), and in the HTML code section, insert the following code, which iterates in the Datasource’s result and shows the name of each station:
<md-select ng-change="sendFilter('id',c)" ng-model="c">
<md-option ng-value="inst.id" ng-repeat='inst in ds' >
inst.name
</md-option>
</md-select>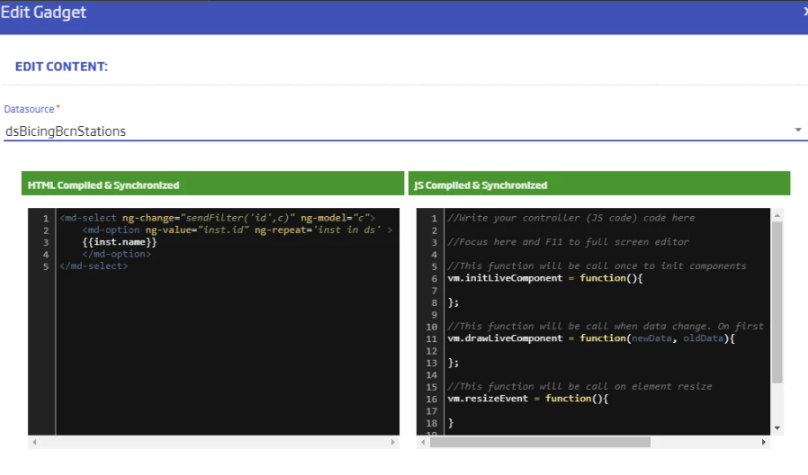
Click on «Compile & Synchronize» and «Close», and the selector will be available on the Dashboard grid.
Include available bike comparator
The next component to be included is a bar diagram, which, once a station is selected in the combo, will show two bars with the available bikes, classified as mechanical and electrical.
Again you will start with the Gadget’s Datasource. In this case, you need to extract from the BicingBCN_Status ontology the number of available electric and mechanical bikes, grouped by the station identifier.
For this Gadget, first create the Datasource, following the same steps as in the previous cases. In this case, you need the name of each station, that you can recover from the BicingBCN_Status ontology – thus, you will use the following query:
select c.BicingBCN_Status.numBikesMechanical as mechanical, c.BicingBCN_Status.numBikesElectric as electric, c.BicingBCN_Status.station_id as id from BicingBCN_Status as c group by c.BicingBCN_Status.station_idOnce the Datasource is created, go back to the Dashboard editor and add a new «Bar Chart»-type Gadget. In the pop-up, choose «New Gadget» and then assign an identifier to the Gadget and choose the previously-created Datasource («dsBicingBCNAvailables»).
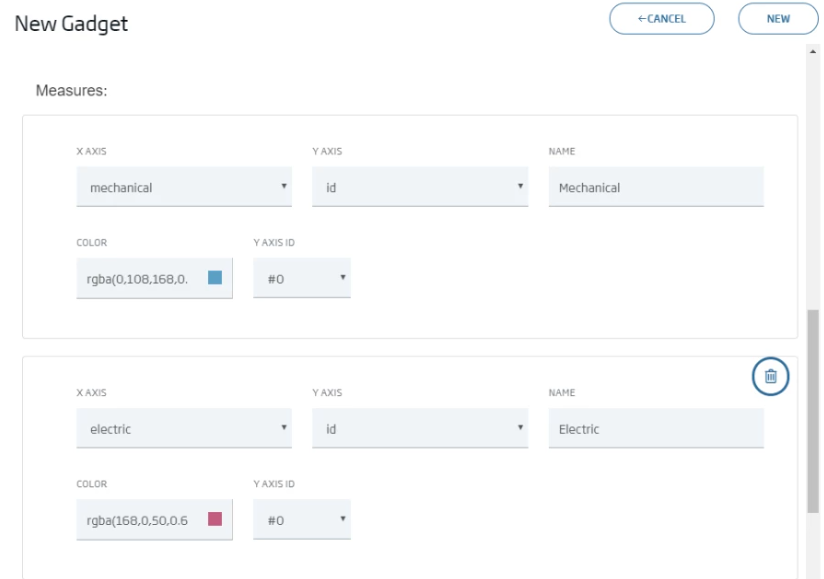
Then, in the «measure» section, specify the columns to be displayed from the attributes retrieved from the Datasource query. Specifically, these will be two columns: mechanical bicycles and electric bicycles (X-axis), both grouped by the ID (Y-axis):
Once the Gadget is created, it appears in the Dashboard grid.
Assigning style and titles
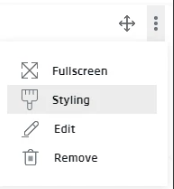
The next step is to give each Gadget a correct title. To do this, you have to choose, on each Gadget, the «Styling» option, then change the title in the «Gadget Title» attribute. Also, in the bar diagram Gadget, you can see that it doesn’t make much sense to show it if it wasn’t filtered previously in the combo, so you’ll have to check the option «Show Gadget only when it is filtered».
Associate filtering in combo with comparison gadget
Lastly, we will create the association that allows to filter the station combo, with the comparator of mechanical-electrical available in each one.
To do this, select to create a «Datalink», by pressing the ![]() button.
button.
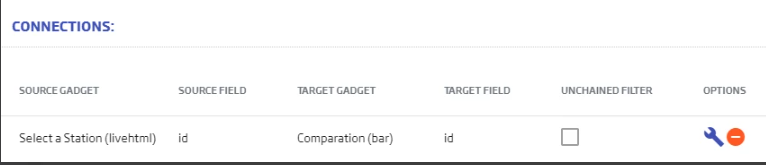
A form then opens, in which you can establish the association between the Source Gadget and the Target Gadget, specifying the filtering attribute. In this case, the Origin Gadget is the combo Gadget and the Target Gadget is the Bar Gadget. In both cases the filtering attribute is «id».
We add it by clicking ![]() so that it appears between the existing connections:
so that it appears between the existing connections:
Test the Dashboard
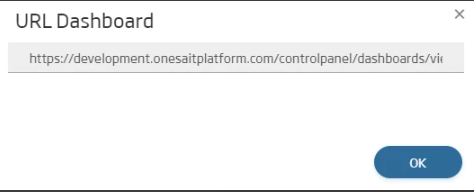
Once the Dashboard is finished, you can test it by accessing its URL. To know its URL, select in the menu: Visualizations & GIS > My Dashboards, so that it appears in the table.
Select the option 
This concludes this fourth part of the workshop. We will soon continue with the next part: REST API.
We hope you found it interesting and do not hesitate to leave us a comment with your opinion or doubts.

Excellent tutorial.