(DEM) Advanced Platform CaaS Monitoring with Prometheus and Grafana
The DEM team (after the initials of their members), made up of Diego, Eduardo and Miguel, and mentored by Miguel, participated in the challenge “Advanced Platform CaaS Monitoring with Prometheus and Grafana”.
Challenge Parts and Goals
For this challenge, Prometheus has been used. Prometheus is an Open Source tool, under an Apache 2 license, for monitoring and managing events with alerts. Prometheus uses a Time Series database for the collection of metrics in real time; and for their representation, it uses Grafana as its Dashboard tool.
One of the strong points in choosing Prometheus is that it is the metrics tool chosen and integrated into other products such as GitLab or Openshift.
The following points will be followed for the challenge:
- VM provisioning in Azure and base software installation (docker, docker-compose, etc…).
- Installation with Docker containers of CaaS (Rancher) for the orchestration and management of Platform services.
- Installation of the Onesait Platform CE version 1.1.0-ce-rc1https://demoteam.onesaitplatform.com/controlpanel or https://onesaitplatform-test-interno.northeurope.cloudapp.azure.com/controlpanel/login starting from the Platform images available on Docker Hub https://hub.docker.com/u/onesaitplatform
- Installation of Prometheus and Grafana, also with Docker containers and orchestrated by the same CaaS.
- Installation of cAdvisor to collect metrics from running containers.
- Installing node-exporter to collect IaaS metrics.
- Installation of rancher-exporter for the collection of CaaS metrics where the Platform is deployed.
- Use of the Python client to communicate with Prometheus and with the Platform.
- Use of Time Series Ontologies to dump Prometheus metrics.
- Use of a Dashboard to represent the metrics.
As a future idea, we consider the capacity to analyze the monitoring data to optimize the use of the infrastructure – Or even the dynamic scaling of the Platform’s infrastructure and services: when detecting that the consumption of resources (CPU, memory) of a host is high, the Prometheus Alert Manager and the Rancher webhooks can be used to scale the number of containers. of a platform service, and even the number of virtual machines where it is deployed.
From the strict point of view of Operations, this challenge allows estimating with a very fine granularity the volume of infrastructure for the Platform (metrics provided by node-exporter) and from the strict point of view of the Platform, it allows the platform to gain in resilency, allowing dynamic scaling of your services (metrics provided by rancher-exporter for CaaS and cAdvisor for running containers)
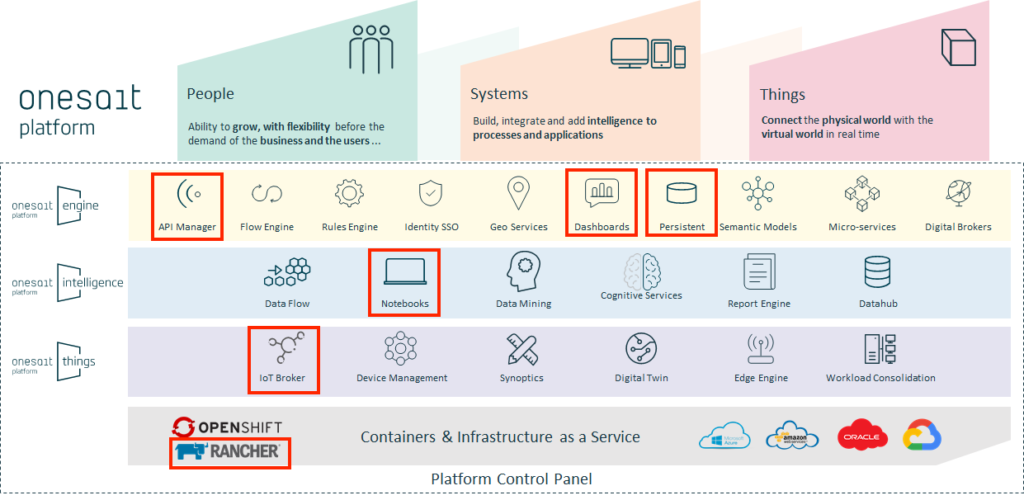
Platform components used:
- Time Series Ontologies: For the collection of Prometheus metrics by time intervals.
- API Manager: To make available the Time Series Ontology to exploit it in another visualization tool (Grafana/Kibana).
- IoT Broker: For the insertion of the metrics through the SSAP protocol of the OP.
- Digital Client: Platform’s Python Client that collects Prometheus metrics via API Rest and inserts them into an ontology using the SSAP / REST protocol.
- Dashboards: For the visualization and interpretation of the data of the Ontology / Metrics.
The challenge
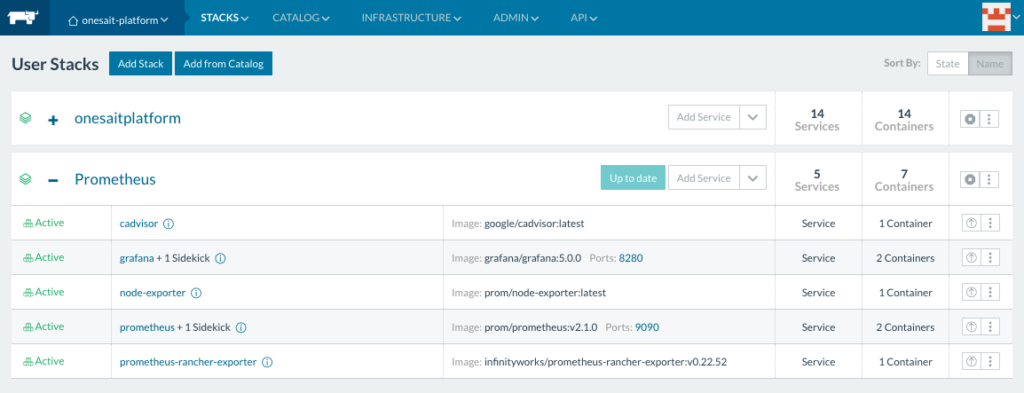
Once the Prometheus services are deployed, they can be seen in the stack of the same name.
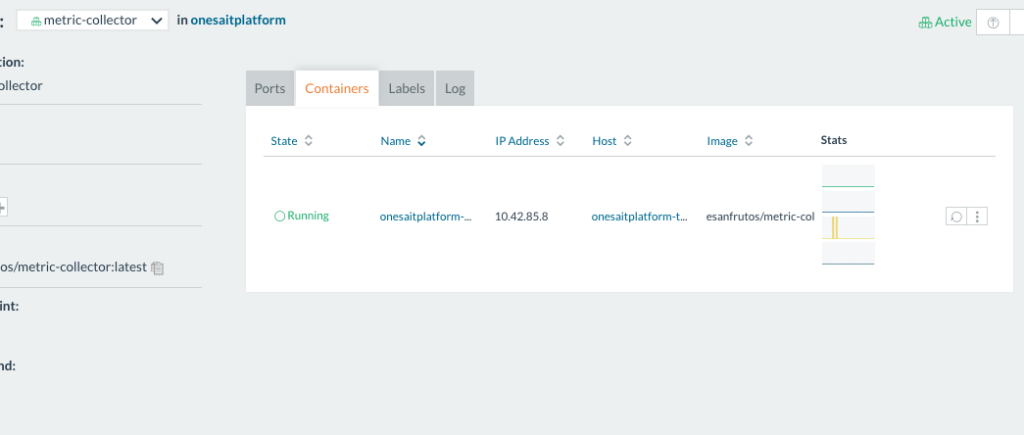
If we access the Grafana that is deployed together with the Prometheus services, we can access, for example, a dashboard that shows us in detail the metrics of the deployed containers.