
Monitoring in Notebooks Engine
This functionality included in version 5.3.0-Ultimate of Onesait Platform, Minsait’s platform, allows you to monitor the individual and overall consumption of Notebooks. In this way, we will be able to know the status of each Notebook, see the running processes, control the status, etc.
Notebook execution modes
Onesait Platform Notebooks (based on Apache Zeppelin) are executed based on interpreters with different configurations, so that a Notebook can execute interpreters in different modes.
The Platform contemplates three modes of interpreter execution in Notebooks:
- Shared: the interpreter process is shared with all the Notebooks, so that parallel executions of this interpreter cannot be made in several Notebooks. The manager is the same for this interpreter. In these cases, since the interpreter is not associated to a Notebook, it will not be possible to know in a simple way which Notebook it has executed, since it can jump from one to another and the resource entity will have to be crossed with the execution entity to be able to know the detail.
- For Notebook:
- Scoped: the interpreter process is common to all Notebooks, therefore it is a manager of several executions.
- Isolated: the interpreter process is also separated by Notebook, so the manager manages only one Notebook. In this case, the interpreter will be associated to a Notebook, so you will be able to know which Notebook it is at all times by the name of the interpreter. If you want to know the detail of paragraphs, you will have to cross the resources entity with the executions entity.
In addition, there are execution modes in Kubernetes so that the execution of each Notebook is delegated to each pod. The manager is kept in this pod as a way to control the various types of executions.
Based on this, the manager (RemoteInterpreterServer process) will be in charge of reporting metrics and execution information to the Platform, regardless of where it is executed.
Metrics available
Two metrics have been created, both of which are complementary:
Resource metrics
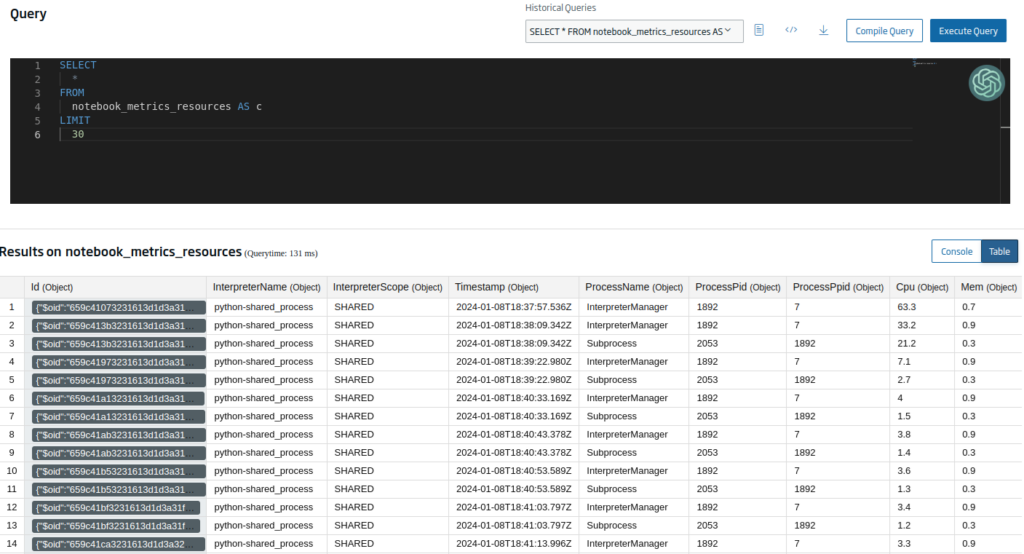
This monitoring is stored in a TimeSeries type entity (notebooks_metrics_resources). At the interpreter level, the processes, type of interpreter (shared, scoped, isolated), if it is associated to a Notebook and the CPU and RAM consumption are extracted.
It has a periodic report (configurable at Notebook module pod level), by default, it will be at ten seconds.
In “shared” interpreter, it will be necessary to cross with the monitoring entity to know which Notebook has consumed the interpreter.
Performance metrics
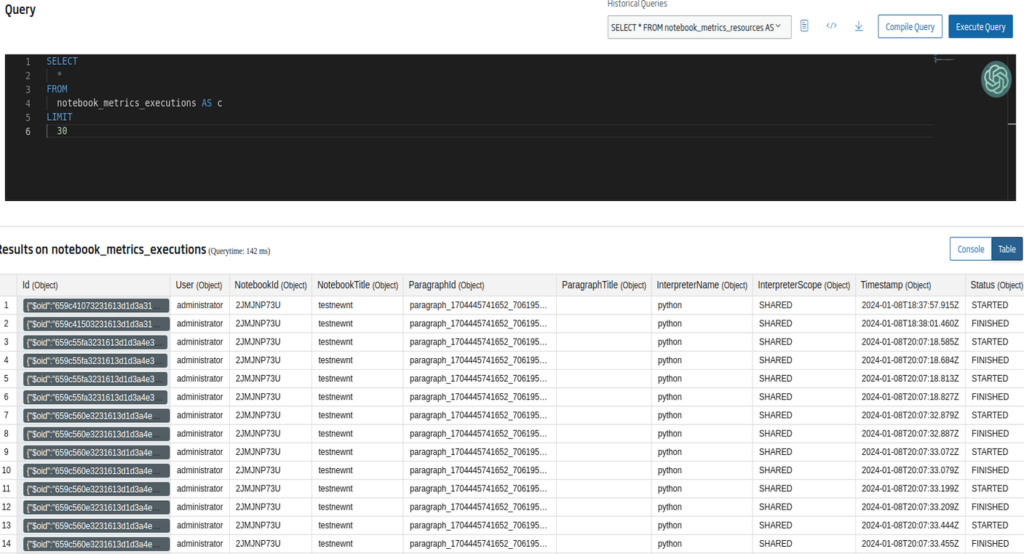
These metrics (notebooks_metrics_executions) give the execution detail of the paragraphs seen by the user, Notebook, paragraph, interpreter, etc.
This monitoring will act as a “history” of executions, it will be stored in its own entity and can be deactivated if it is not necessary.
With this monitoring, crossed with the previous one, we will be able to know the real consumption per paragraph.
Metric Reports
There are two methods for the metrics report:
- Push report from interpreter: through these environment variables (included in the zeppelin-env.sh) access is configured, via Digital Client, to two entities on which the above metrics will be inserted.
#### Monitor reporter zeppelin onesait platform ####
export ZEPPELIN_INTERPRETER_MONITORREPORTER_ENABLE=true
export ZEPPELIN_INTERPRETER_MONITORREPORTER_DIGITALCLIENT_HOST=https://development.onesaitplatform.com/iot-broker
export ZEPPELIN_INTERPRETER_MONITORREPORTER_DIGITALCLIENT_NAME=notebook_metrics_client
export ZEPPELIN_INTERPRETER_MONITORREPORTER_DIGITALCLIENT_INSTANCE=notebook_metrics_client_interpreter
export ZEPPELIN_INTERPRETER_MONITORREPORTER_DIGITALCLIENT_TOKEN=XXXXXXX
export ZEPPELIN_INTERPRETER_MONITORREPORTER_ENTITY_RESOURCES=notebook_metrics_resources
export ZEPPELIN_INTERPRETER_MONITORREPORTER_ENTITY_EXECUTIONS=notebook_metrics_executions- Report from Zeppelin API Rest: through a new API created (actuator type) it is possible to know the consumption of all the interpreters (resource metrics). In this case, it is not possible to obtain the execution metric since it depends on its temporality.
Several endpoints are available:
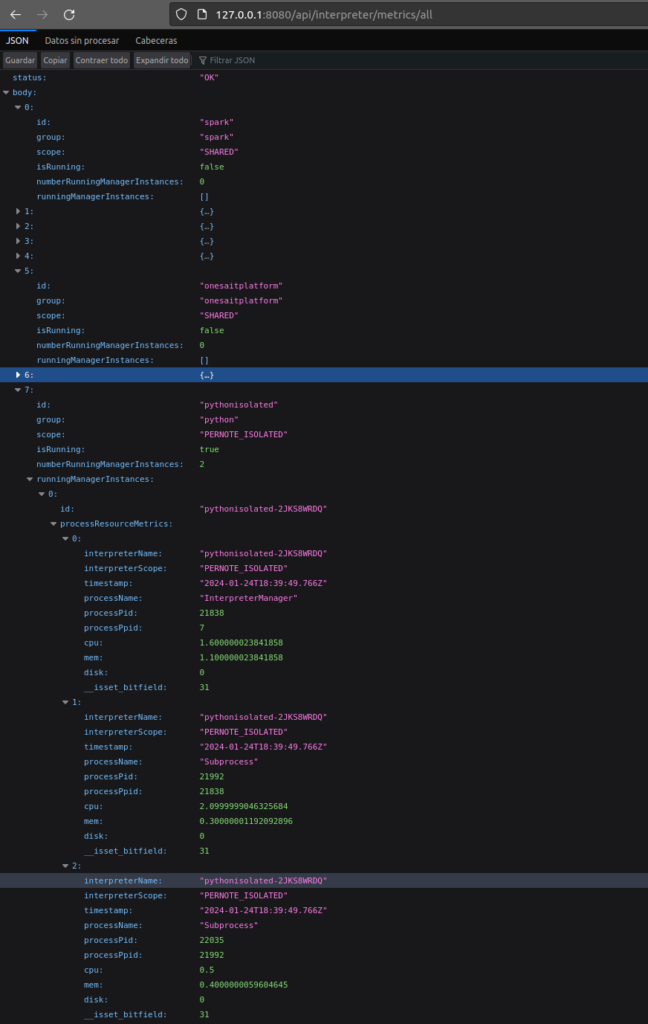
- /api/interpreter/metrics/all: get all the resources of the Zeppelin interpreters as well as their status and consumption.
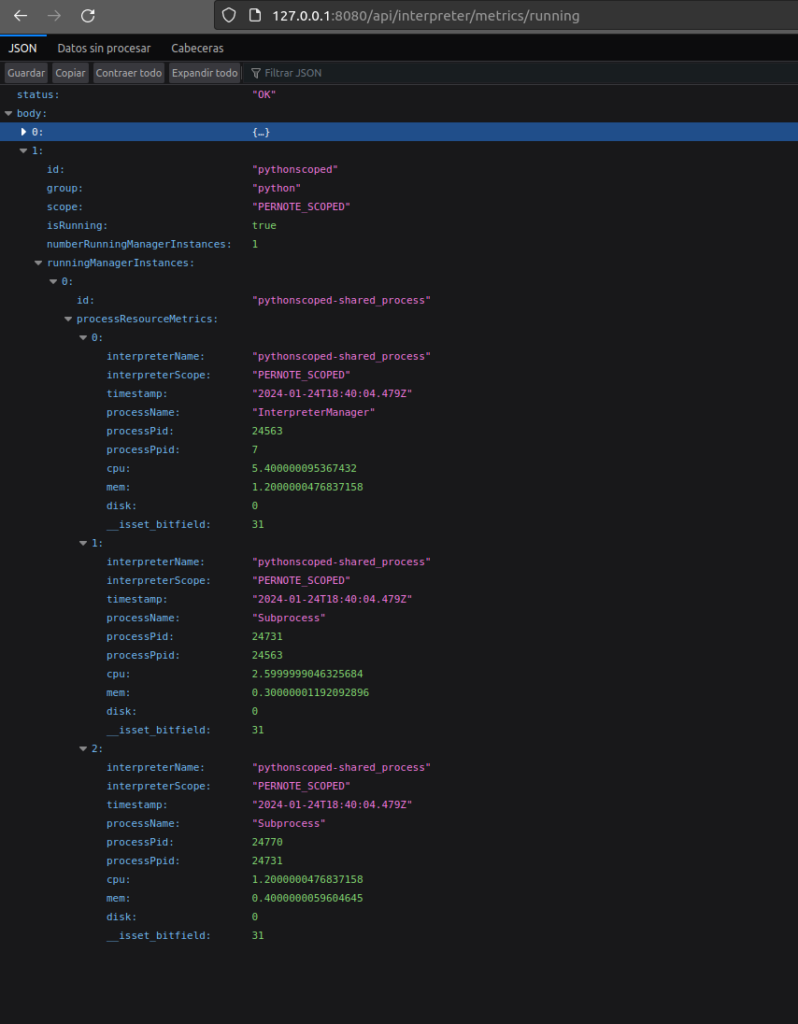
- /api/interpreter/metrics/running: get all the resources of the Zeppelin interpreters started as well as their status and consumption.
- /api/interpreter/metrics/notebook/{notebookId}: get all the resources of the Zeppelin interpreters for the parameterized Notebook as well as their status and consumption.
- /api/interpreter/metrics/running/notebook/{notebookId}: get all the resources of the Zeppelin interpreters started for the parameterized Notebook as well as their status and consumption.
- /api/interpreter/metrics/interpreter/{interpreterId}: get all interpreter resources by id (Python, Spark, onesaitplatform, etc.) as well as their status and consumption.
Next Steps
For future versions we plan to continue working on the following points:
- To have controls over them in the Platform (Notebooks user interface): to be able to use the above elements in the Notebooks interface to know the assets, to be able to stop them in a simple way, etc.
- Dashboard for easy visualization of metrics.
- Limit the use of Notebook processes by RAM and CPU.
If you are interested in learning more about how we monitor Notebooks on Onesait Platform, feel free to leave us a comment or send us a notice on our Onesait Platform support channel.
Header image: Henry & Co. at Unsplash