Container Security Solutions: Anchore
Container-based solutions like Docker are very popular for building infrastructure using just a few lines of code. These solutions have a repository, known as Registry, where they store all the images that have been previously built, in order to used them later. Over the past few years, many images with embedded malware or riddled with vulnerabilities have already been detected in the public repository (Docker Hub), as we can see below.
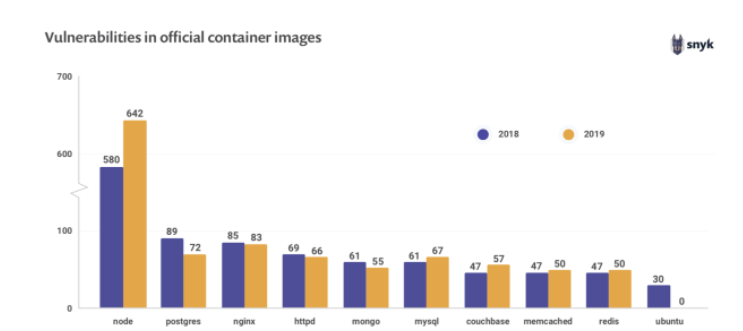
This problem puts the security of the infrastructure at risk through the applications that are consuming these images, and that is why it is critically important to avoid storing images that could pose a security problem in our repository.
What is Anchore?
Anchore, or Anchore Engine, is an open source (with proprietary versions), policy-based, static analysis tool for Docker containers. It automates image inspection, analysis, and evaluation, with user-added checks to secure deployments by ensuring the deployment content meets certain criteria.
Besides, the way that policies are defined and evaluated, allows the policy evaluation itself to function as an auditing mechanism, which in turn allows timely evaluations of image properties and of specific content attributes.
How does it work?
Anchore follows these steps for each image analyzed:
- It obtains and extracts the content of the image, but never executes it.
- It analyzes the content of the image, extracting and classifying as much metadata as possible.
- It saves the scan result to the database for future use and auditing.
- It evaluates the policies against the previously saved scan output, including vulnerabilities found in artifacts discovered in the image.
- It updates the data used for policy and vulnerability evaluation, then automatically updates the image analysis result in case there is new data.
- It notifies the users about the results obtained in the evaluation of policies and discovery of vulnerabilities.
- It repeats steps 5 and 6 to ensure they have been tested with the latest external changes.
The main interface is a Rest API that provides tools for requesting scans, evaluating policies, monitoring images in logs, as well as querying image content and scan results.
There are two main ways to run Anchore:
- Interactive Mode: Uses the API to explicitly request image analysis, policy evaluation, and content reporting, but only performs operations when specifically requested by a user.
- Watch Mode: Uses the API to configure the Anchore Engine to poll registries and specific repositories/tags to check whether new images are being added, and if so, it automatically pulls and tests them, issuing notifications when a given tag’s vulnerability or a policy test status changes.
How is it used?
According to its documentation, the Anchore Engine can be used in two main ways:
Besides, it is available as a Docker image and can be run locally via a Docker Compose easily. We can also find different plugins and alternatives to add Anchore to CI/CD, such as Jenkins, Gitlab CI, Kubernetes, etc.
Anchore locally
Let’s focus on running Anchore locally using Docker, because it is the fastest way to run the tool and see its different features.
Initialization and initial checks
Firstly, we need to download and start the docker-compose file provided by Anchore:
~ curl -O https://engine.anchore.io/docs/quickstart/docker-compose.yaml
~ docker-compose up -d
After executing the second command, we check that everything has been initialized correctly using the command:
~ docker-compose ps getting the following result:
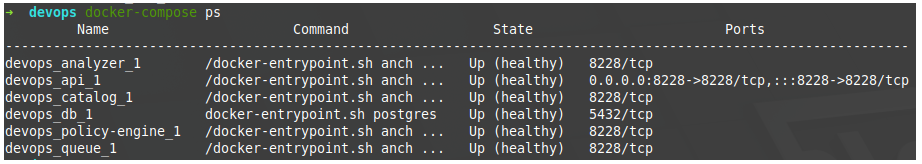
One of the services that Docker Compose has is the API, which we can use to use the client directly through Docker without the need to install it on our local device. So, let’s take advantage of it to check internally that everything has been initialized correctly in the containers:
~ docker-compose exec api anchore-cli system status getting the following result that indicates that everything is operational:
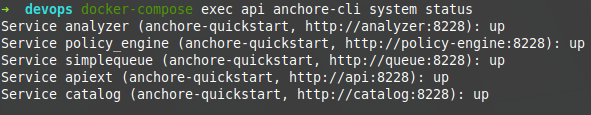
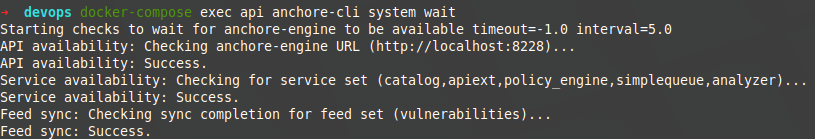
Finally, within this verification phase, it is convenient to check that we are correctly synchronized:
~ docker-compose exec api anchore-cli system wait getting the following result:
Adding an image to analyze
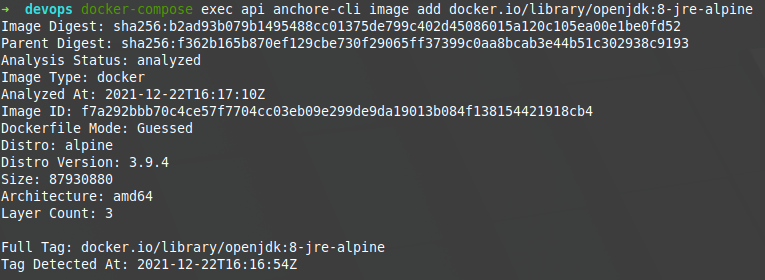
Let’s analyze the openjdk public image in its version 8-jre-alpine. To do this, we must first add it through our client.
~ docker-compose exec api anchore-cli image add docker.io/library/openjdk:8-jre-alpine which will show us something like the following image:
Then, not mandatorily, you can make checks on said image before analyzing it. For example, you can see its content.
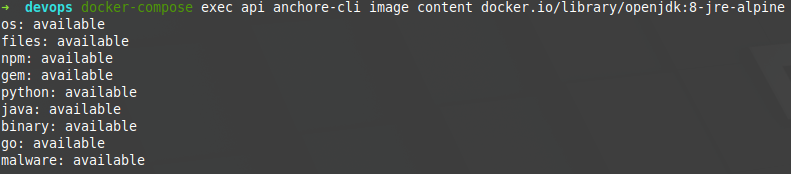
being able to specify what type of content you want to see in a greater detail:
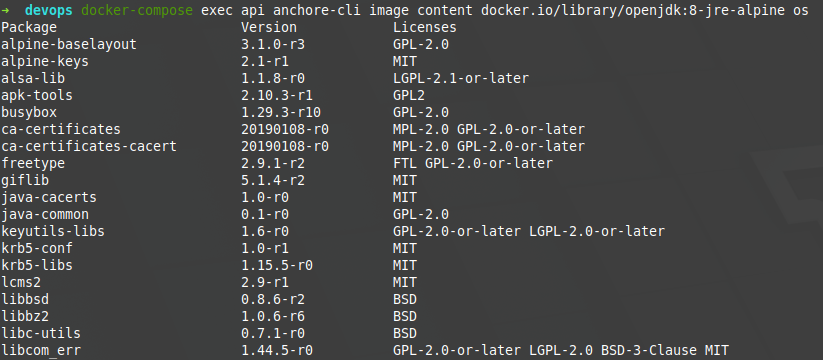
In this case, we would be seeing installations of the OS in the image, along with its version and its corresponding licenses, an information that may be useful for future analysis.
Evaluating the image
Firstly, to evaluate an image, its vulnerabilities must be analyzed, and THIS is done as follows:
~ docker-compose exec api anchore-cli image vuln docker.io/library/openjdk:8-jre-alpine all Its digest can also be used as an image identifier, and it is recommended to use it to avoid ambiguity problems caused by its labeling. As a result, we would obtain something similar to the following image:
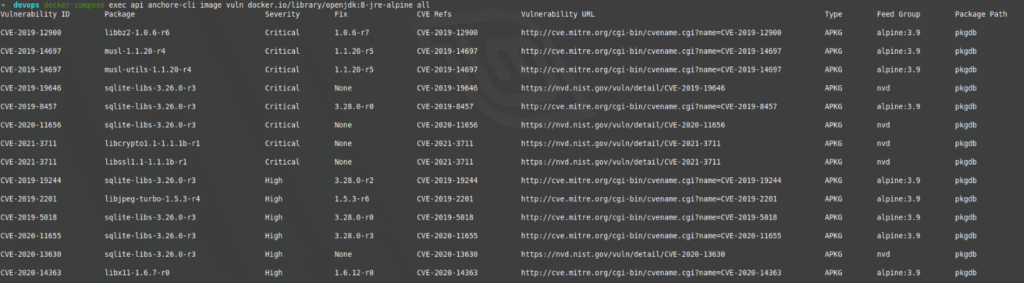
As we can see, it offers us a list of vulnerabilities identified by their CVE code, with their severity, the version in which it is fixed (if documented), and a link to MITRE to see the details of the vulnerability. In this case, many vulnerabilities have been identified and many of them classified as critical and high.
The last step that we have to do, is to apply the policies to this image whose vulnerabilities have been discovered. In this case, we are going to use Anchore’s default policies, which simply check that there are no high or critical vulnerabilities.
~ docker-compose exec api anchore-cli evaluate check docker.io/library/openjdk:8-jre-alpine --detail getting the following result:
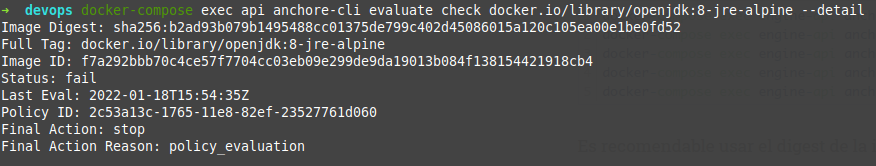
As we can see, the status of the evaluation has been «fail». This would cause the CI/CD process in which the tool was, to stop and not move on to the next one, preventing the image from being uploaded to the repository, for example.
Interpreting the result
Before trying to understand the results that an evaluation offers us, we need to review what Anchore’s policies are and how they work.
Anchore Policies
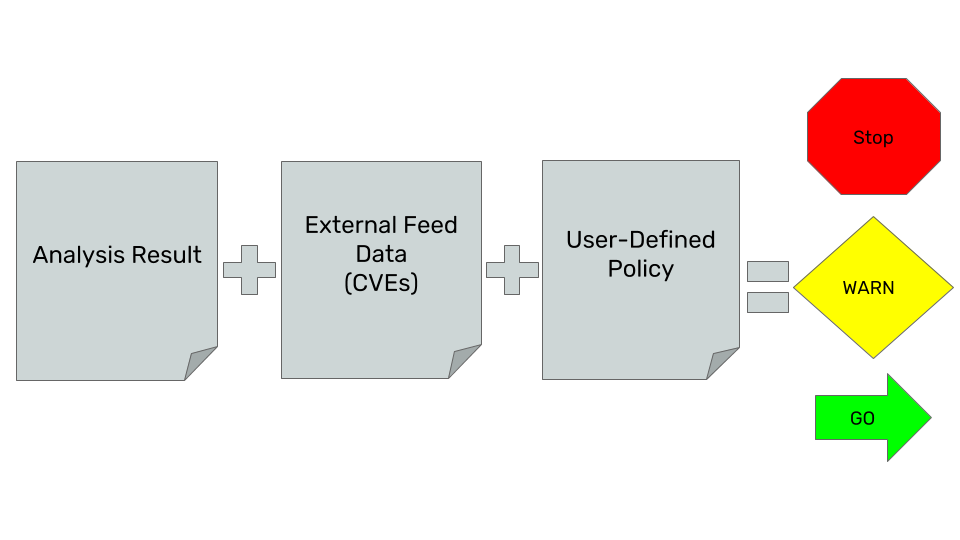
A policy is a set of user-defined rules, represented as a JSON object within a Bundle (a set of policies), each of which defines a specific check to perform and a resulting action to issue if the check returns a match when the image is analysed.
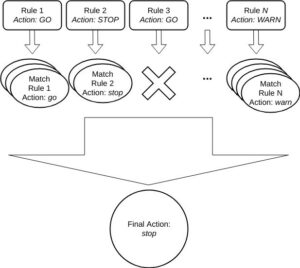
When an evaluation of a specific policy is launched, all the triggers defined within the previously commented JSON file are executed, thus executing the actions defined for each of the matches found during the evaluation itself. At the end, a final check is executed based on the set of actions that have previously occurred, as can be seen in the following image.
To learn more about the policies, we recommend that you visit their documentation.
False positives
Like any static analysis tool, the results of this one may include false positives. It is important to carry out an analysis with specialized personnel (SIA) on the results obtained, in order to rule out those that may imply a blockage.
Policy evaluation
After the evaluation of each of the defined triggers, a final action is executed, that can result in one of these three states:
- STOP: if any of the activated triggers contains this action, a general stop will happen.
- WARN: If any of the activated triggers contain this action, but none of the others have a STOP, the evaluation will end in WARN. Therefore, this does not cause a stop.
- GO: If none of the triggers have a WARN or STOP then the evaluation will end as GO. This has no impact on the evaluation itself, but it is quite useful to keep track of all the versions that an image has gone through, something quite useful for audits.
Conclusions
- Anchore Engine is a very useful tool, as it allows us to inspect, analyze and evaluate images inside and outside the CI/CD cycle.
- It is easily integrated into the CI/CD cycle through Jenkins: https://plugins.jenkins.io/anchore-container-scanner/
- What makes this solution really interesting is the definition of customizable rules and policies, where we can indicate a whitelist and blacklist as appropriate, and definitions of Stoppers or Alerts. These configurations, when defined in a JSON, can be stored in a repository where properties can be queried, modified and deleted as appropriate.
References
- Anchore Engine Documentation: https://engine.anchore.io/docs/
- 10 Docker Security Best Practices: https://snyk.io/blog/10-docker-image-security-best-practices/
Header image: diarioinforme.com